Category Archives: Ruby

Visualizing Texas Death Row Data

A look into death row inmates of Texas, USA.
The data is from https://github.com/zmjones/deathpenalty
Which is put together from Texas Department of Criminal Justice

oldsparky

Year by Race Stacked Bar Chart:
RaceTotalExecutedTexas

Year by Age Scatter Chart:
AgeYear Scatter Chart

Year by Race Area Chart:
areachartbyrace

Last Words – Word Cloud generated by Tagul. Click to enlarge
WhiteCloud BlackCloud HispanicCloud

By County over 5
ByCounty

Ruby Used for Scatter Chart:
AgeYearScatterRuby

Ruby Used for Stacked Race By Year:
RacetotalExecutedTexasRuby

Ruby: Visualizing NBA Player Salaries 2013 – 2018

In this post I visualize the player salaries of a few select teams of interest, and the top player salaries across all teams.

nbalogo


The data is from a post i found on /r/datasets   This post

NBA Salaries by Player, Team, and Agent 2013-2019

Chicago Bulls
BullsSalaries

Miami Heat
HeatSalaries

Charlotte Bobcats
BobdatSalaries

Orlando Magic
Orlando magic

Brooklyn Nets
NetsSalaries

Toronto Raptors
raptorssal

All players over $10 Million USD
2013SalByPlayerOver10Mil

Ruby used to parse CSV Data for all players:
ruby_ByPlayer

Ruby: Visualizing 2014 Chicago Budget Recommendations

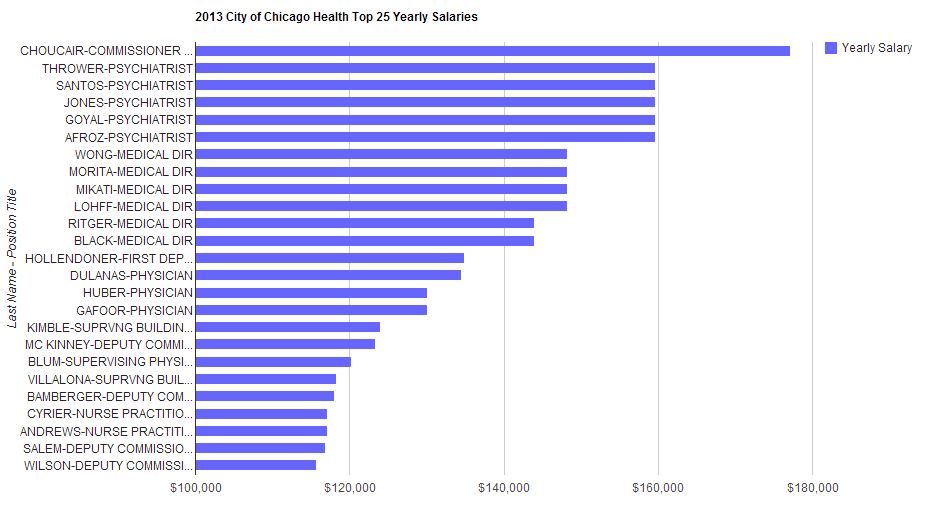
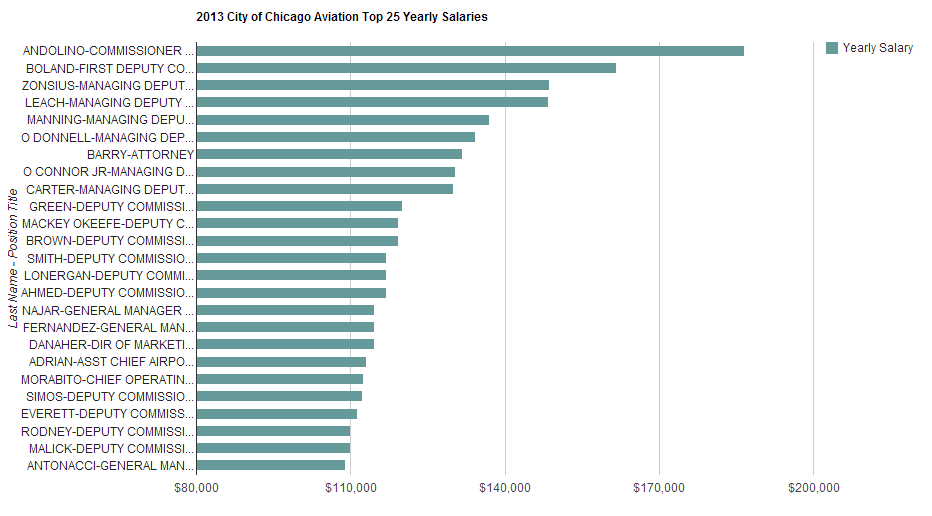
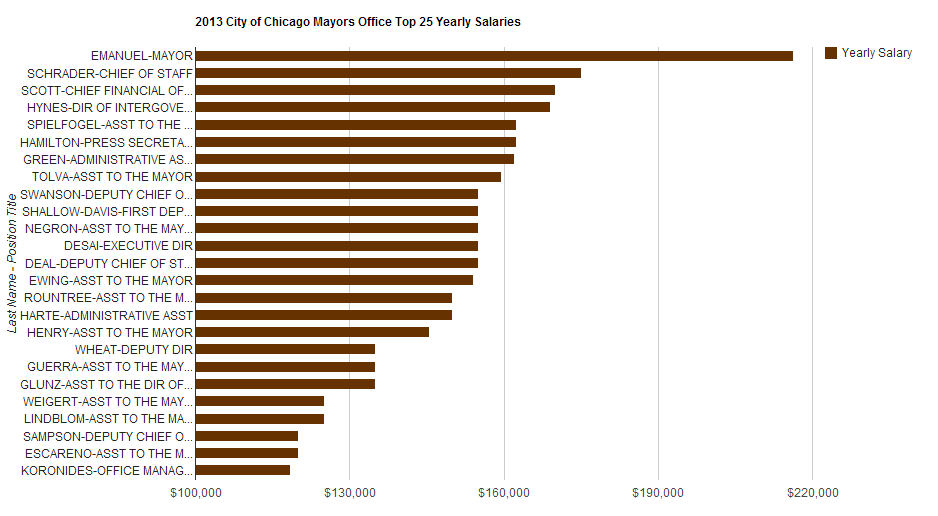
Once again, the data is from City of Chicago Data portal

chicago

The dataset details 2014 Budget Recommendations, which is the line-item budget document proposed by the Mayor to the City Council for approval. Budgeted expenditures are identified by department, appropriation account, and funding type: Local, Community Development Block Grant Program (CDBG), and other Grants. “Local” funds refer to those line items that are balanced with locally-generated revenue sources, including but not limited to the Corporate Fund, Water Fund, Midway and O’Hare Airport funds, Vehicle Tax Fund, Library Fund and General Obligation Bond funds. Owner: Budget and Management. Frequency: Data is updated annually. For more information about the budget process, visit the Budget Documents page:

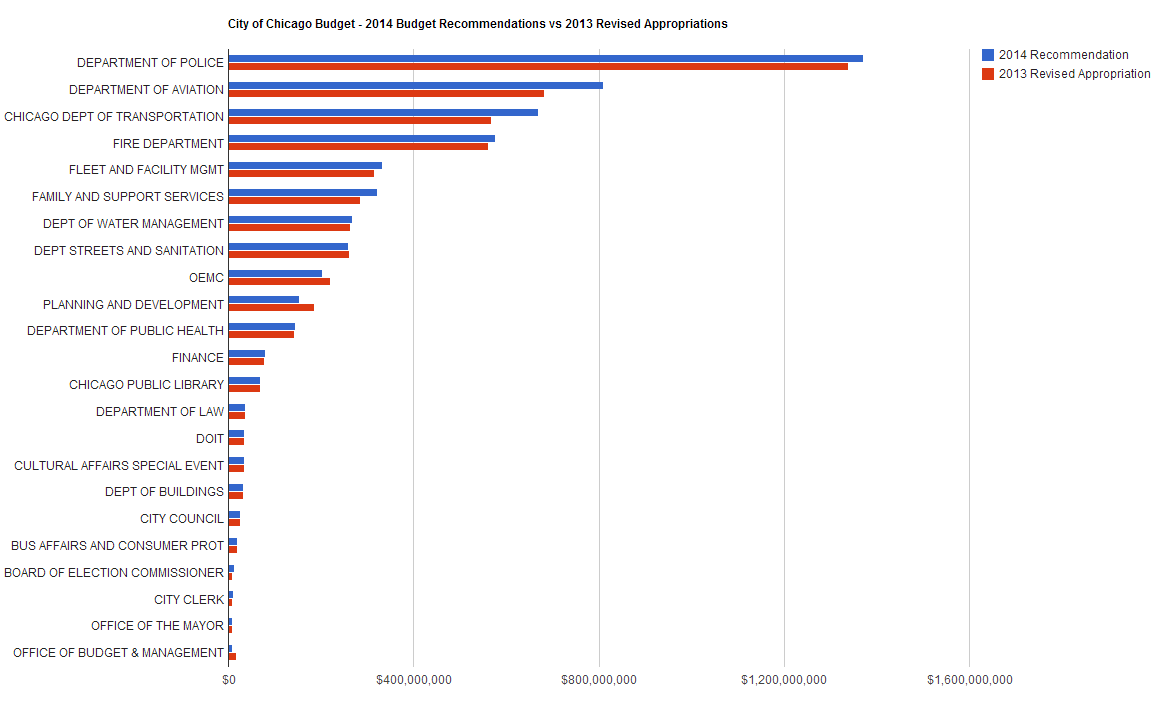
Here is a breakdown of the 2014 recommendations compared with revised 2013 appropriations by department.

Over 10 million dollars and excluding Finance General
2014Chicago_Budg_Dep_rec_vs_2013_approp

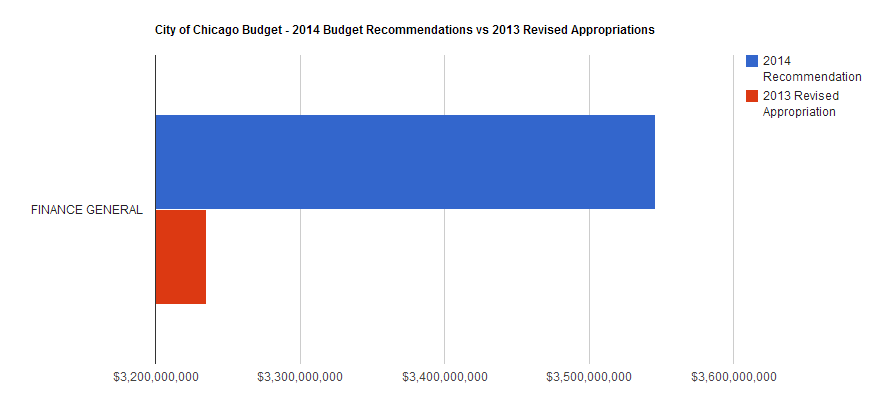
Here’s Financial General
FINANCE GENERAL 2013 appro_2014 Rec

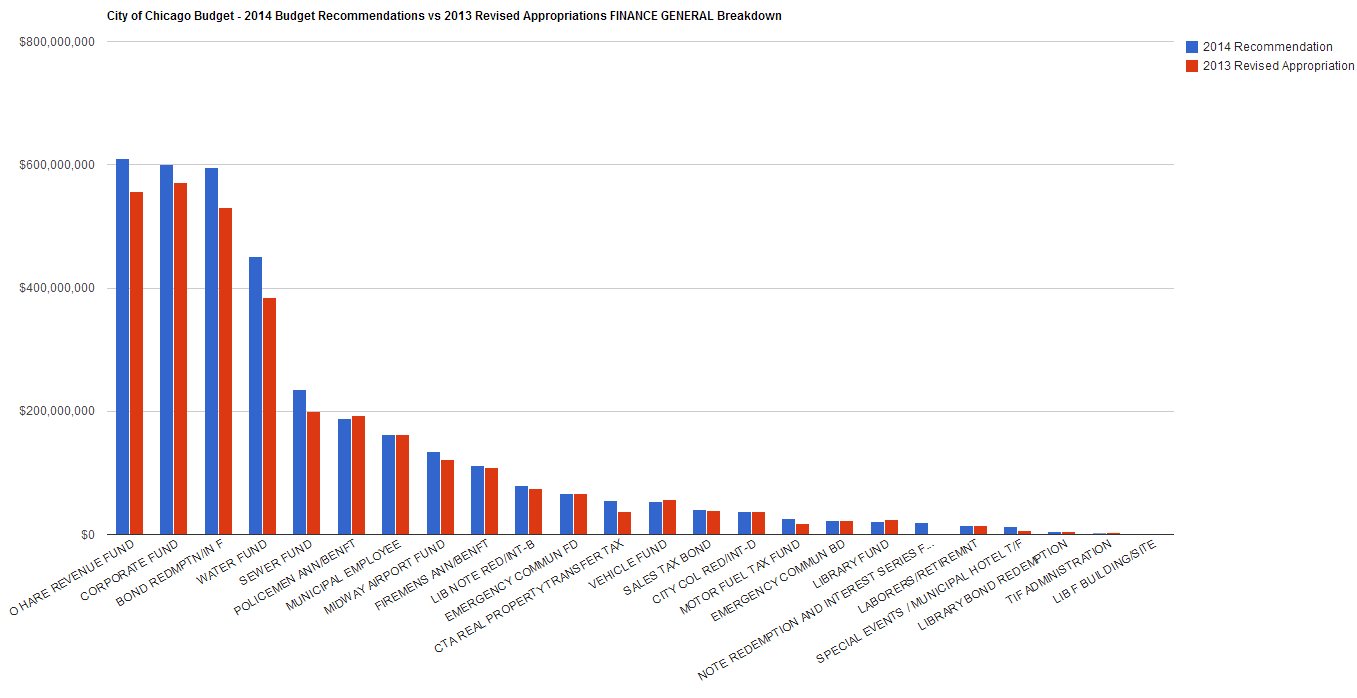
Breakdown of Financial General
GenFinvs

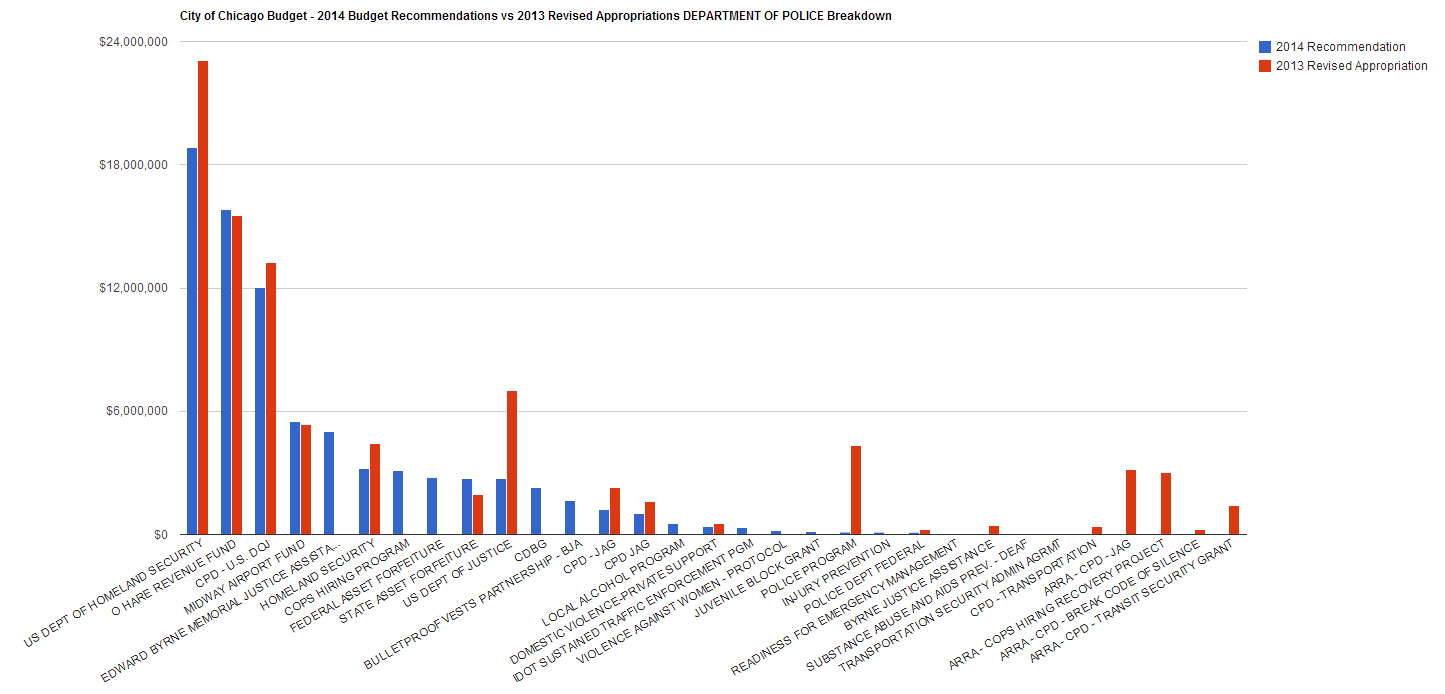
Police Breakdown excluding Corporate Fund
Police breakdown

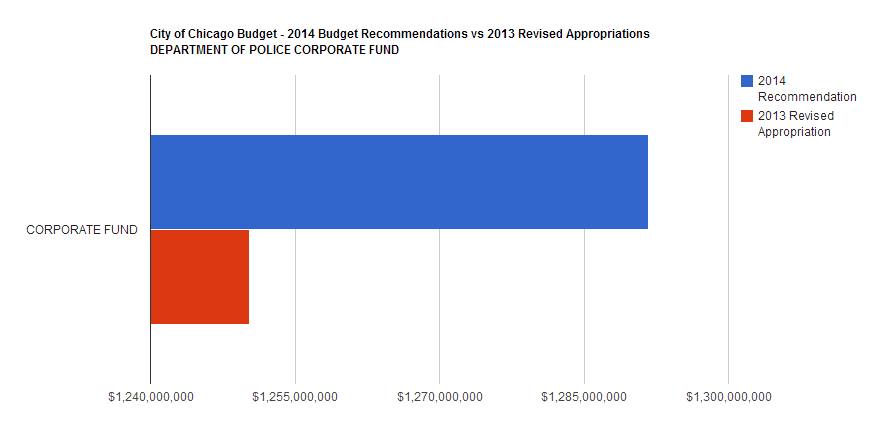
Police Corporate Fund
Police corporatefund20132014

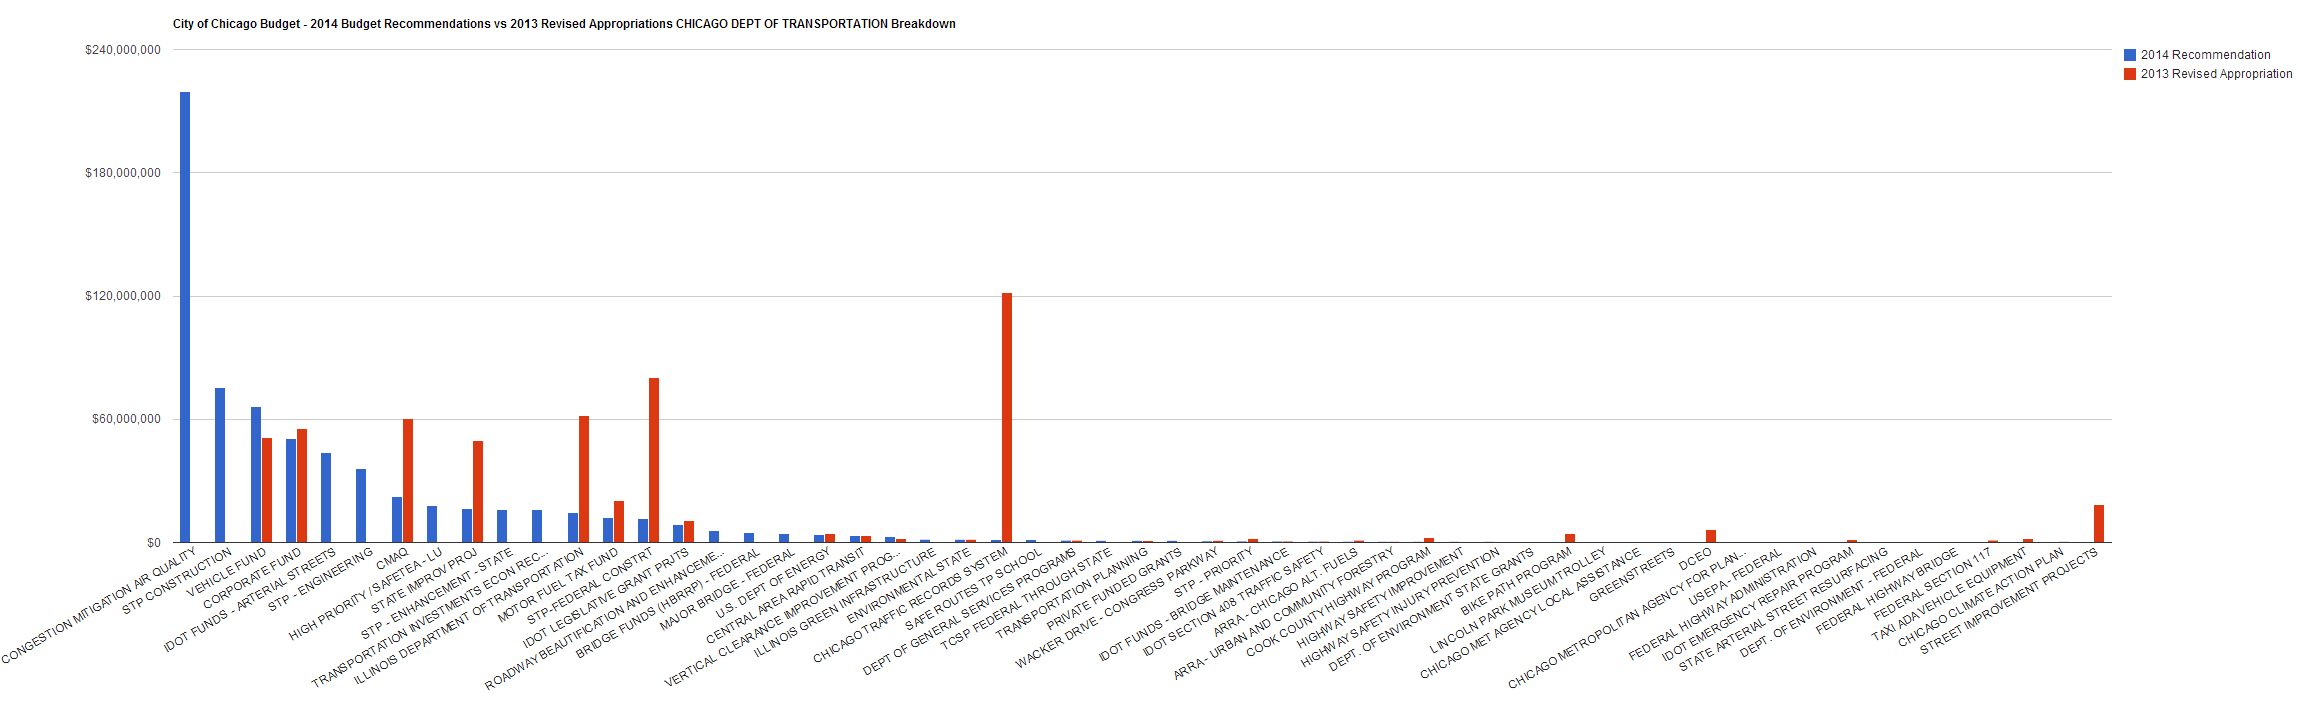
Department of Transportation
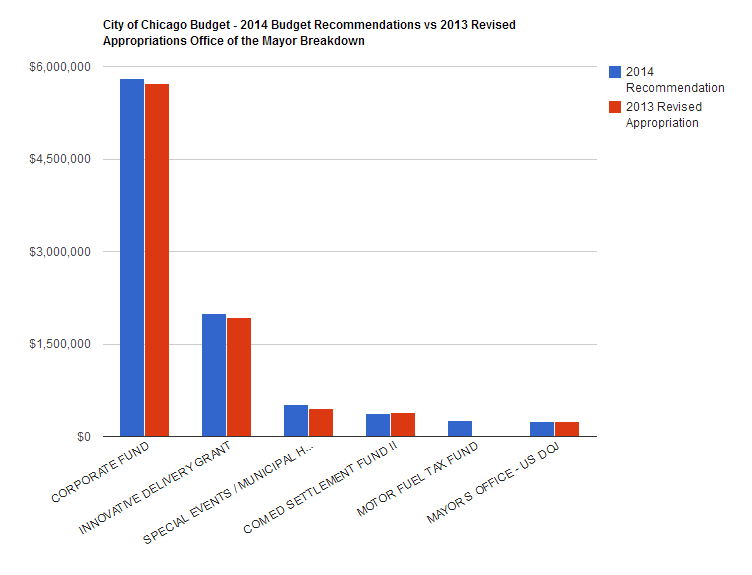
DeptTransportBreakdown

Office of the Mayor
Office of mayor


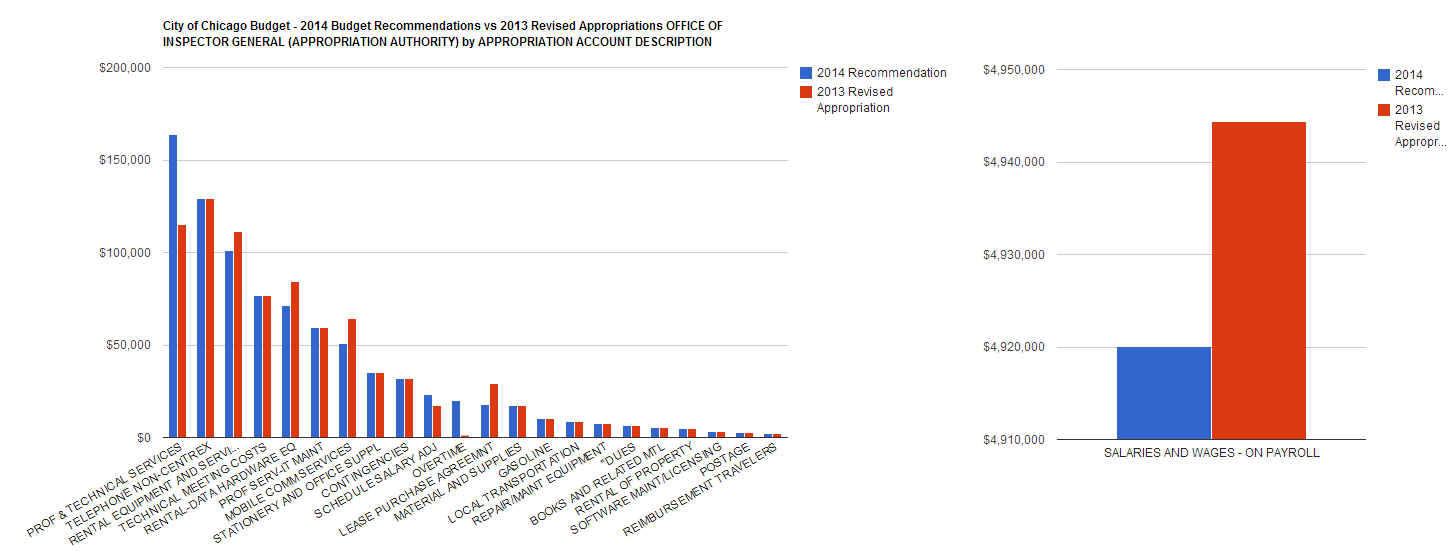
City of Chicago Budget – 2014 Budget Recommendations vs 2013 Revised Appropriations OFFICE OF INSPECTOR GENERAL (APPROPRIATION AUTHORITY) by APPROPRIATION ACCOUNT DESCRIPTION

Office of Inspector General Both


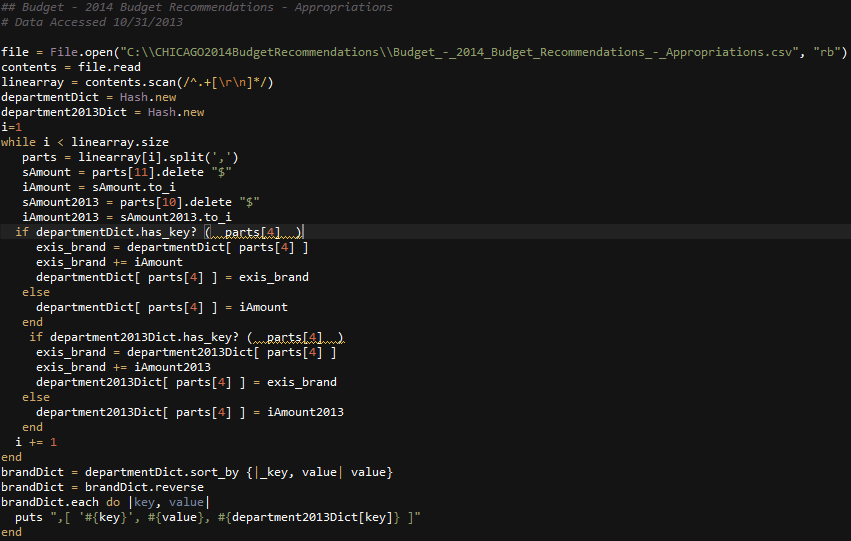
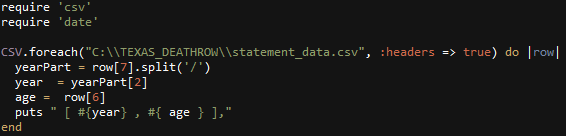
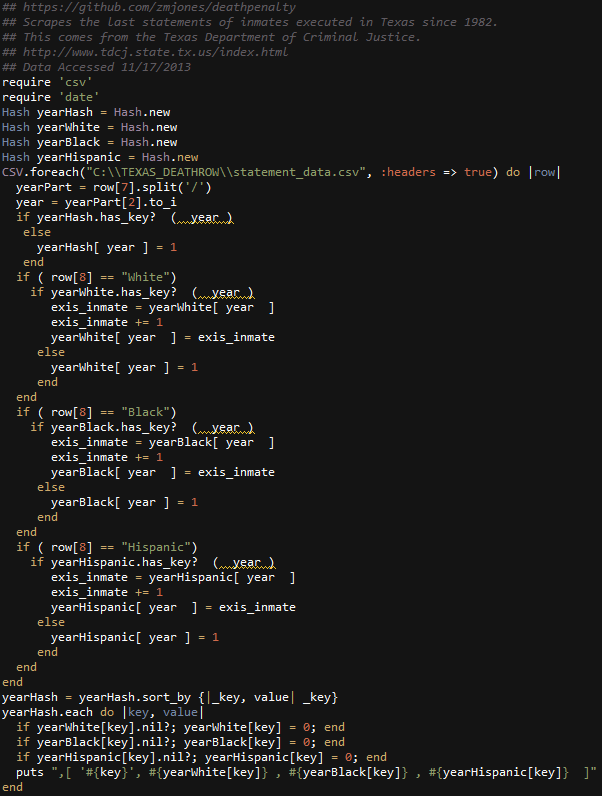
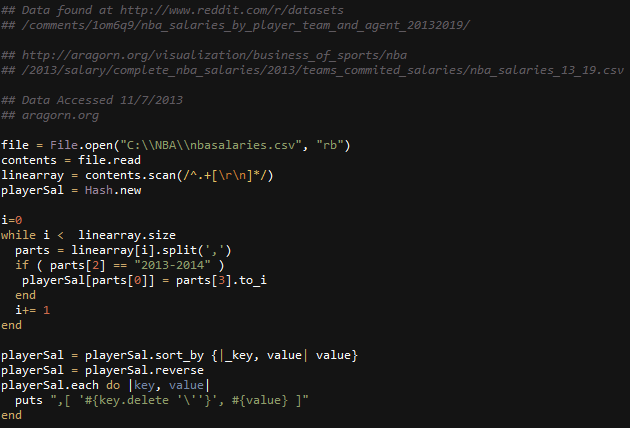
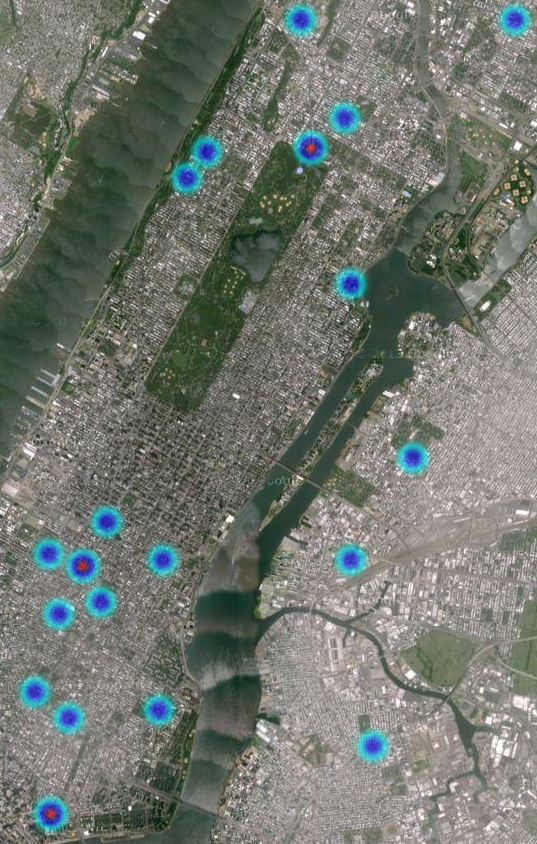
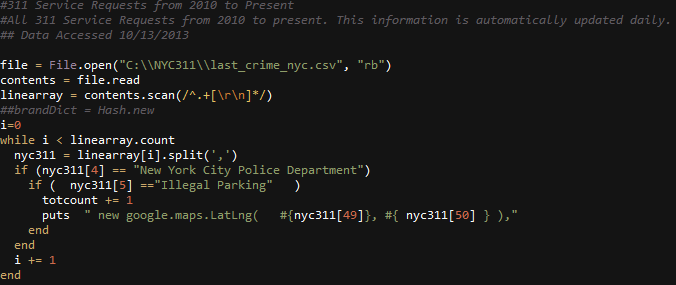
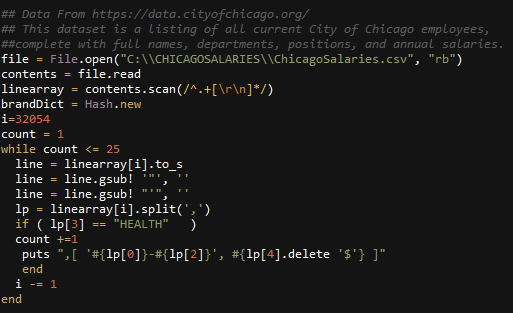
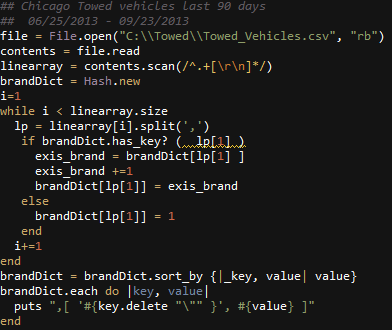
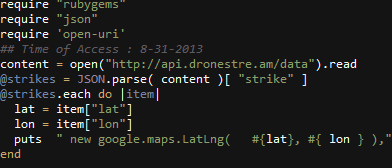
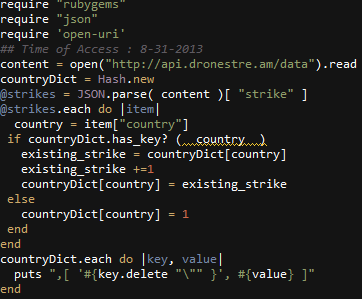
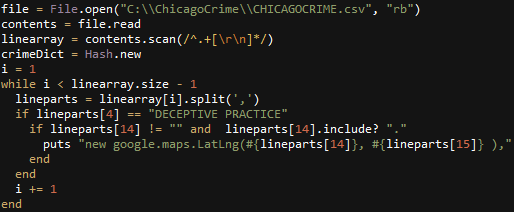
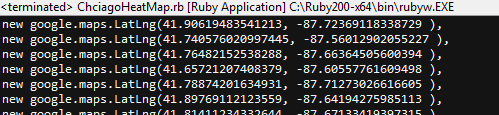
Ruby example used to parse the data
RubyFor2013vs2014

Ruby: Visualizing New York City’s 311 Service Requests by NYPD.

Data is from https://nycopendata.socrata.com

NYC flags

All 311 Service Requests from 2010 to present. This information is automatically updated daily.

These are all the complaint types and their counts for NYPD.

311 Service Requect Chart

These are a couple of heatmaps for all noise related calls :
“Noise – Commercial”, “Noise – Street/Sidewalk”, “Noise – House of Worship”, “Noise – Vehicle”, “Noise – Park”

NYC NOISE
mcALLNOISEmcNOISE2

Homeless Encampments
mcHomeless Encampments

Ruby
rubyusedtoparse

Ruby: Visualizing 2013 City of Chicago Top 25 Yearly Salaries.

The data is from https://data.cityofchicago.org/

This dataset is a listing of all current City of Chicago employees, complete with full names, departments, positions, and annual salaries. For hourly employees the annual salary is estimated. Data Owner: Human Resources. Frequency: Data is updated quarterly.

POLICE
mc_Police

FIRE
mc_fire

HEALTH
mc_Health

AVIATION
mc_Aviation

MAYOR’S OFFICE
mc_mayor

How the Data was parsed and formatted.
parsingthechicagodata

Ruby: Graphing Chicago Towed Vehicles by Brand and Color

cartowedformat

Data is from City of Chicago Data Portal

This dataset displays location for vehicles that have been towed and impounded by the City of Chicago within the last 90 days. Illegally parked vehicles, abandoned vehicles and vehicles used for illegal activities may be towed by the Chicago Police Department, the Department of Streets and Sanitation, the Department of Revenue, Aviation and the office of the City Clerk.

TIME RANGE 06/25/2013 – 09/23/2013 (90 Days)

VEHICLE COLOR
ChicagoTowedByColor

VEHICLE BRAND
ChicagoTowed by brand

Ruby Code used to parse and manicure data.
rubycarparse

Ruby: Visualizing United States Jail Data by Race and State.

JAIL DATA!

SomeJailFromWikipedia

Data is from
National Archive of Criminal Justice Data
http://www.icpsr.umich.edu/icpsrweb/NACJD/studies/33722

Use the dataset’s cookbook file to make sense of specific headers
states are coded as number, create a hash for all numbers
hashnew

Create a hash table for each race with the State as the Key. Then Parse the file, and populate each hash with the inmate count.
step2

Export JSON in GoogleCharts Acceptable format
step3

Here’s a Stacked Column Chart
MantasCodeRaceJailChart

Visualizing US Drone Strike Data.

This morning I discovered an interesting data set

Historical Data About Every Reported United States Drone Strike
from http://dronestre.am/
homepic

THIS DATA WAS ACCESSED 8/31/2013

So I decided to make some quick visualizations using Google api.
The Data can be downloaded in JSON format and looks like this:
json

Parse out the coordinates of each strike using ruby:
ruby_heatmap

Heat Maps
HeatMapSatDroneStirkeAfgan_pak_borderheatmap

Accumulate strike totals by country:
pirbycountry

Pie Chart By Country
Country Pie

Code to display the date of a strike, and its attributes; deaths, civilians, injuries, and children.
stackedareaRuby

Reported US Drone Strikes 2012 – 2013 stacked chart
2012-2013Drone Strikes

Entire Time Range of drone.am dataset accessed 8/31/2013

EndtireDataSetImage

Ruby: Using Google Maps Heat Map to Display Chicago Crime Statistics

Each crime report contains latitude and longitude coordinates.  I used ruby to parse out each coordinate from this source :  https://data.cityofchicago.org.  Then I appended those points into a heat map.

Update: This dataset has been expanded on, in this post DataViz: Visualizing Chicago Narcotics Crime Data.

Chicago DECEPTIVE PRACTICE – 8/8/2012 to 8/8/2013

DECEPTIVE PRACTICE

Chicago ALL CRIMES – 8/8/2012 to 8/8/2013
HEATMAPOFCRIME

Chicago NARCOTICS – 8/8/2012 to 8/8/2013
NARCOTICS

Chicago HOMICIDE – 8/8/2012 to 8/8/2013
murderonlysat

Ruby example to parse all coordinates for Primary Crime Type: DECEPTIVE PRACTICE
RUBY

Output
output