
In this post, I will give a semi-detailed overview of how to make an animated heat map over a time range. This is my first attempt at making an animated heat map.
I will be revisiting Chicago crime statistics from City of Chicago Data Portal 2001-2013
This dataset reflects reported incidents of crime (with the exception of murders where data exists for each victim) that occurred in the City of Chicago from 2001 to present, minus the most recent seven days.Data is extracted from the Chicago Police Department’s CLEAR (Citizen Law Enforcement Analysis and Reporting) system. Read More about the dataset here
On 11/28/2013 I downloaded a csv from chicago’s data portal named Crimes_-_2001_to_present.csv, its size was 1,050,688 KB
Here is an example of how I would parse out all coordinates of narcotics violations for the month of January in 2013.
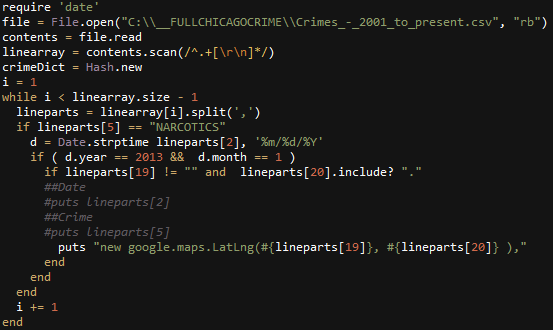
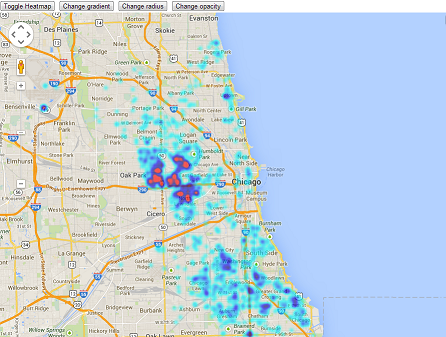
Lets test the coordinate outputs by appending them into a google maps heatmap.
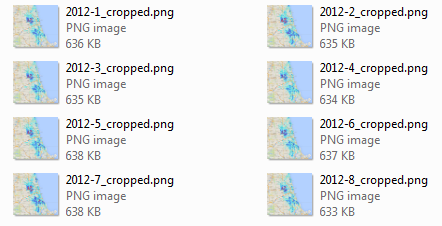
Okay, now I’m going to manually make one of these images (with static center and size) for each month from January 2012 to October 2013. Next, I wrote a quick c# application using ImageMagick to programmatically crop each Browser screenshot.
string[] files = Directory.GetFiles(@"c:\__FULLCHICAGOCRIME\Months\ScreenShots"); foreach (string file in files) { string ext = Path.GetExtension(file); if (ext == ".png") { string filenameNoExt = Path.GetFileNameWithoutExtension(file); string filenameExt = Path.GetFileName(file); Directory.CreateDirectory(@"c:\ImageConversion\" + filenameNoExt); Process imProcess = new Process(); string im_command = file + @" -crop 800x800+500+300 c:\__FULLCHICAGOCRIME\Months\ScreenShots\cropped\" + filenameNoExt + "_cropped.png"; imProcess.StartInfo.UseShellExecute = false; imProcess.StartInfo.RedirectStandardOutput = true; imProcess.StartInfo.FileName = @"c:\__FULLCHICAGOCRIME\Months\ScreenShots\convert"; imProcess.StartInfo.Arguments = im_command; imProcess.Start(); imProcess.WaitForExit(); } } |
Now I have the frames for my animation.
Lastly, I append all these images into a movie using Windows Movie Maker, and add some Beethoven as background music.
Enjoyed this. I’ve been playing with San Francisco’s crime data and thought about doing heatmaps but haven’t got around to it. I think this’ll be inspiration for that.
SF data is similarly formatted with category and description. One thing I found neat was isolating the cracks, heroin and cocaines from the marijuana-related offenses. The difference in freq. of occurrence between high problem districts and low problem districts gets even more stark. The contrasting geographic clustering might lend itself really well to visualization through heatmapping.