Category Archives: Ruby

Chicago Cannabis Decriminalization

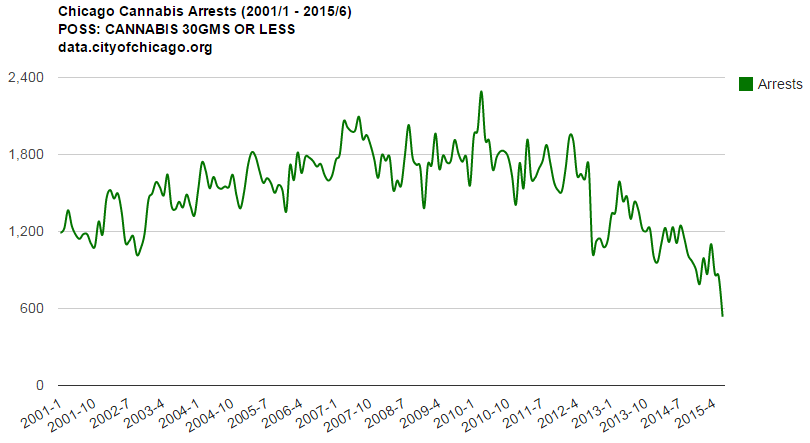
A look into Chicago Police Department’s incident reports for marijuana related arrests.

ChicagoCannabisArrests_STill

The chart below displays over 15 years of CPD’s Cannabis related arrests for possession of 30 grams or less. The data is from data.cityofchicago.org

ChicagoCannaBisArrests_2001-2015_monthly_lessthan30gms

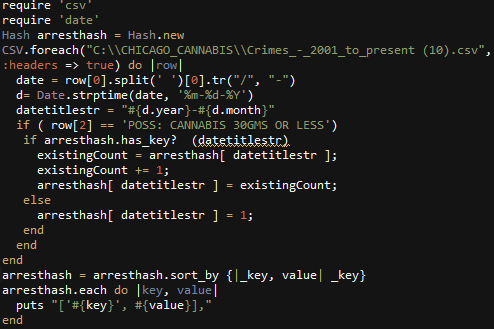
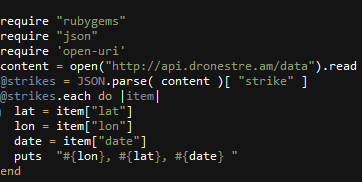
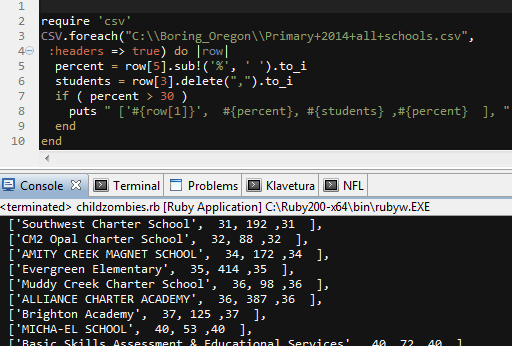
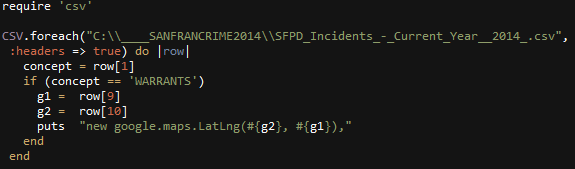
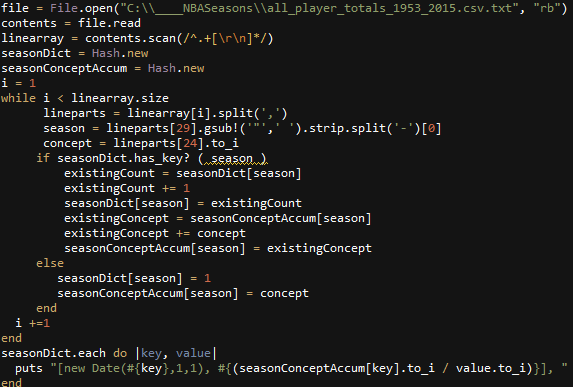
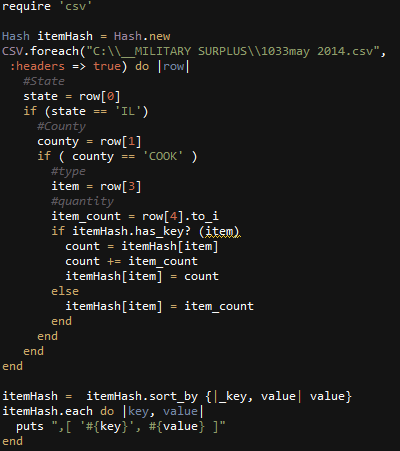
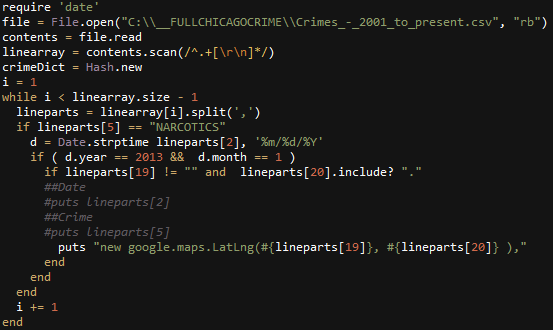
Here is the ruby code written to accumulate the monthly totals. Additional data filtering was done on the Socrata website prior to exporting the csv data file. Google Charts was used to create the line chart. CartoDB was used to create the still of the torque map.
rubytoparsechicagocannabis

Oregon’s Unvaccinated Children

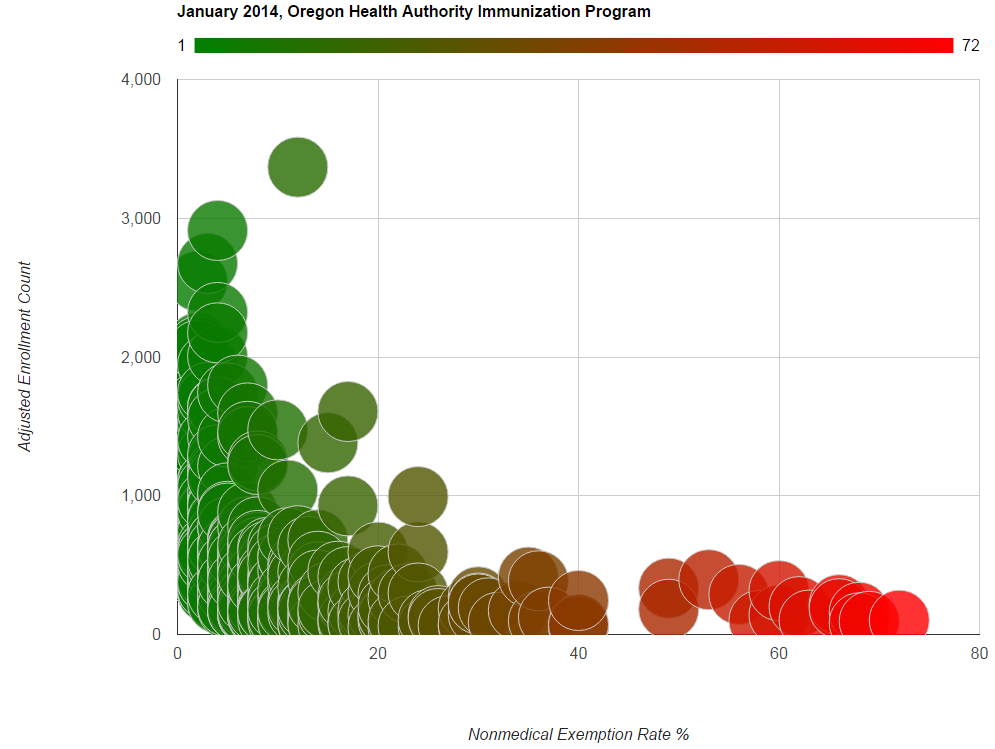
2014 Oregon Health Authority Immunization Program
Data found here

Y Axis Adjusted Enrollment Count
X Axis Nonmedical Exemption Rate %

OregonImmunizationProgram

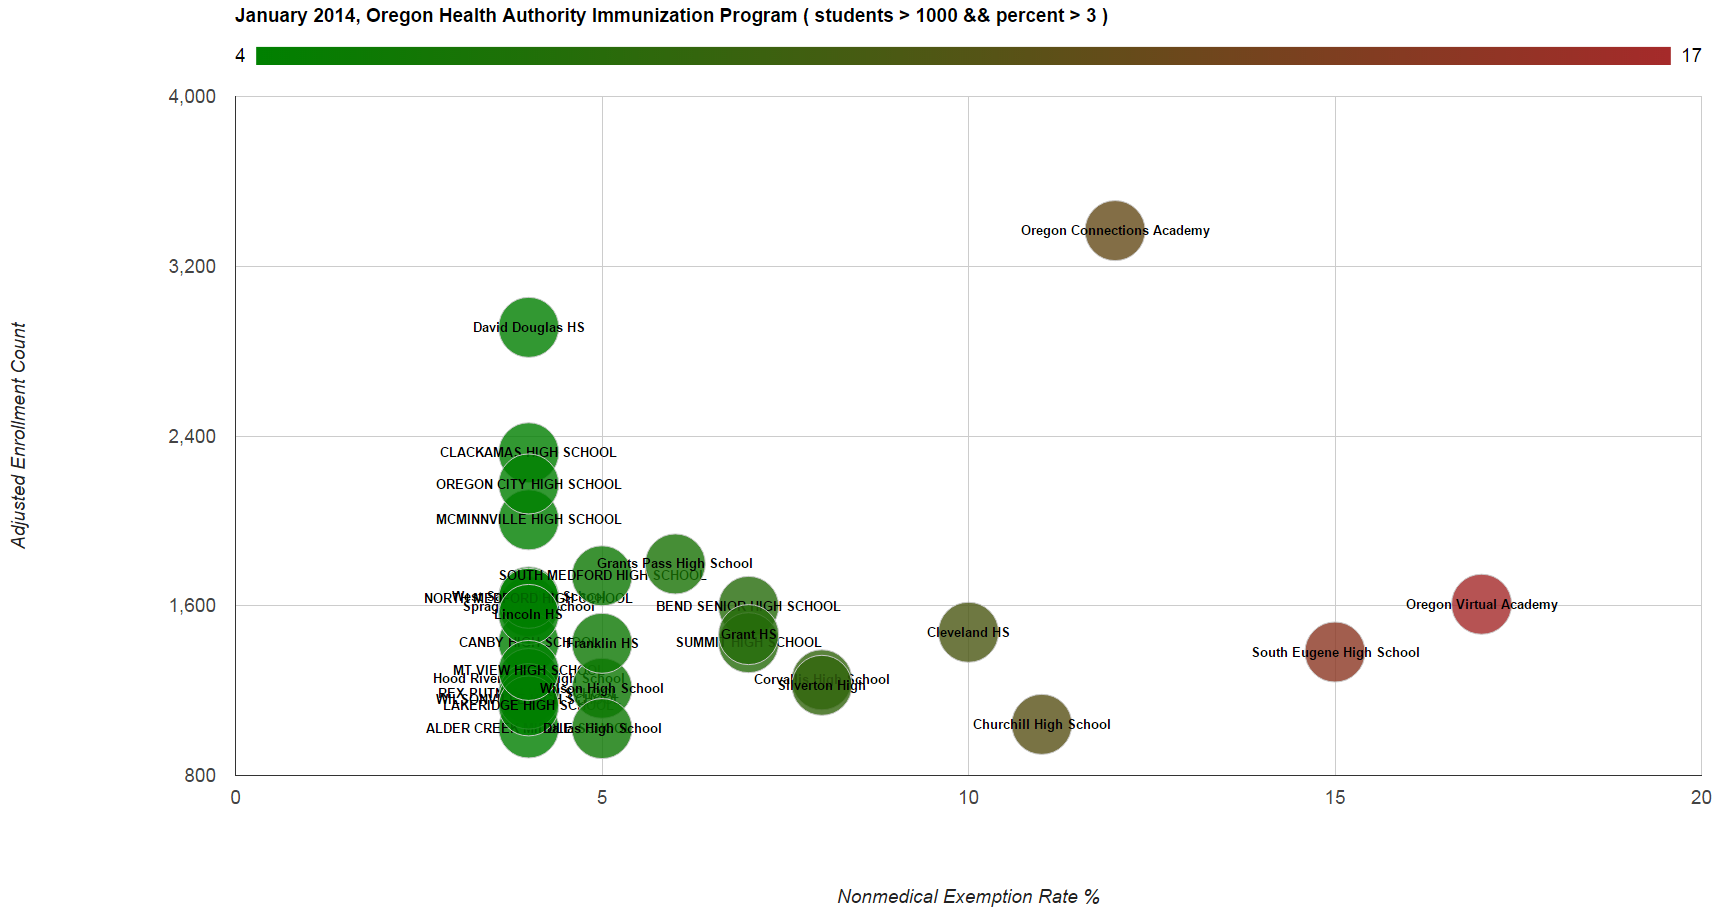
Now let’s add some School Names to the tail ends of the chart above.
(Click on images for higher resolution)

Over 1,000 Enrolled and Nonmedical Exemption Rate % Greater than 3
School Names with over 3% percent of unvaccinated and have over one thousand students..
ImmunizedOver1000Over3percent

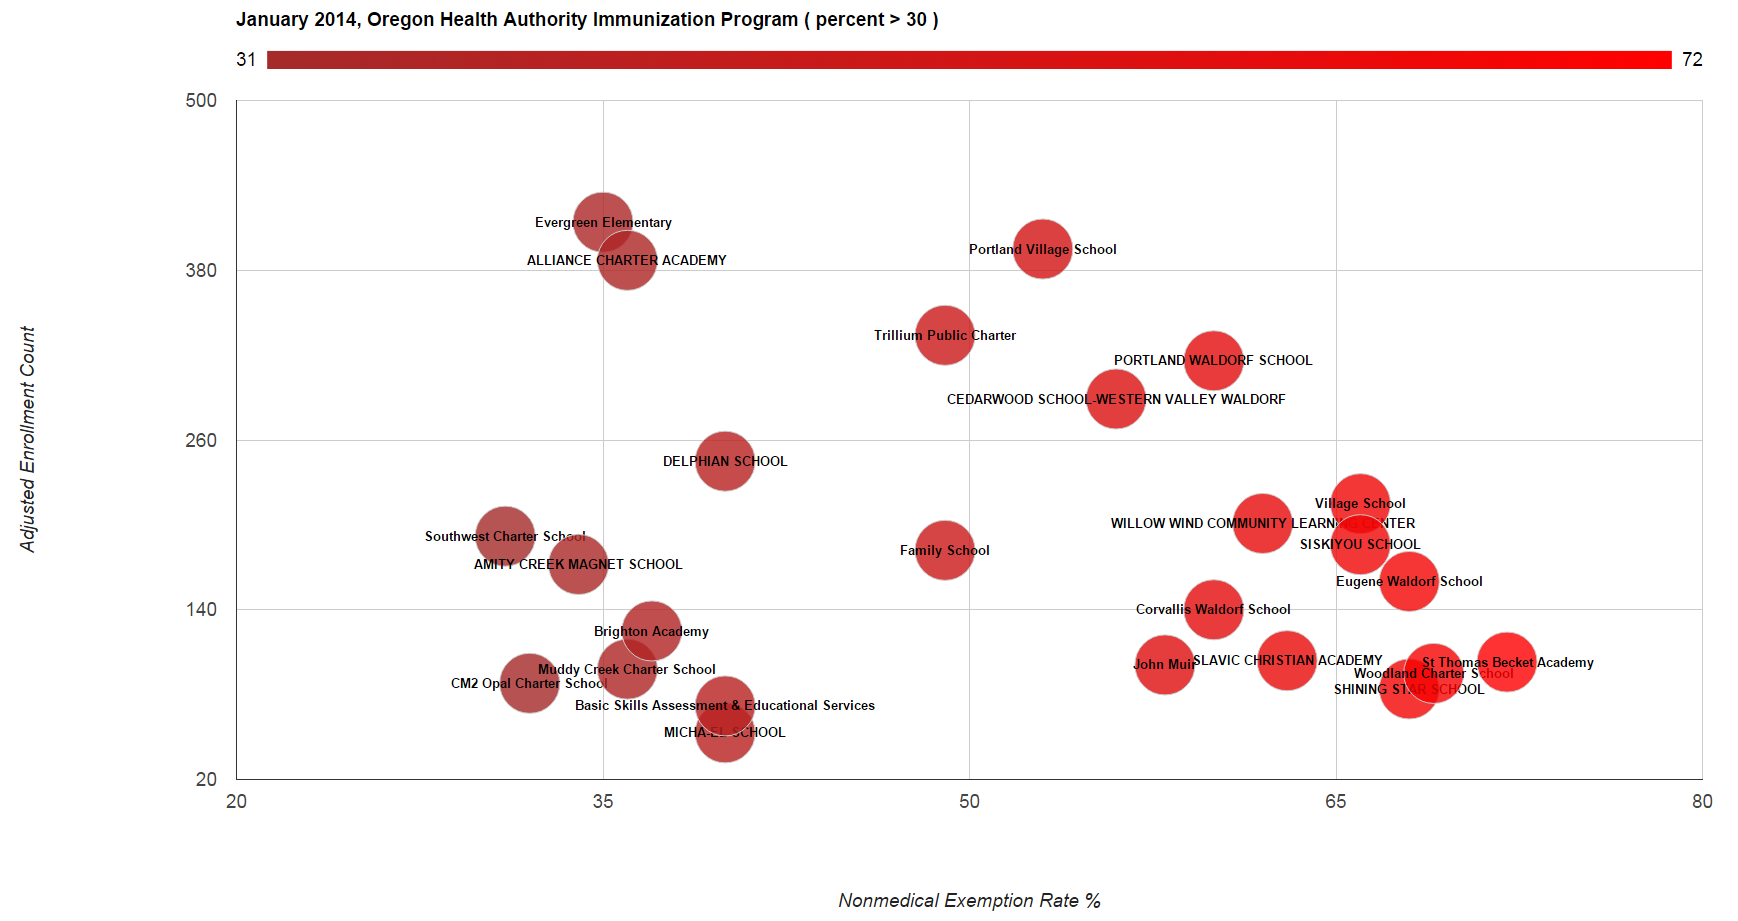
Nonmedical Exemption Rate Greater than 30 Percent
School Names with largest percentage of unvaccinated.
OregonOver30PercentNonimmune__

Ruby Example:
parsingOregon

West Side Chicago Narcotics Enforcement Migrations

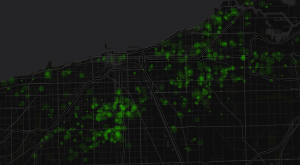
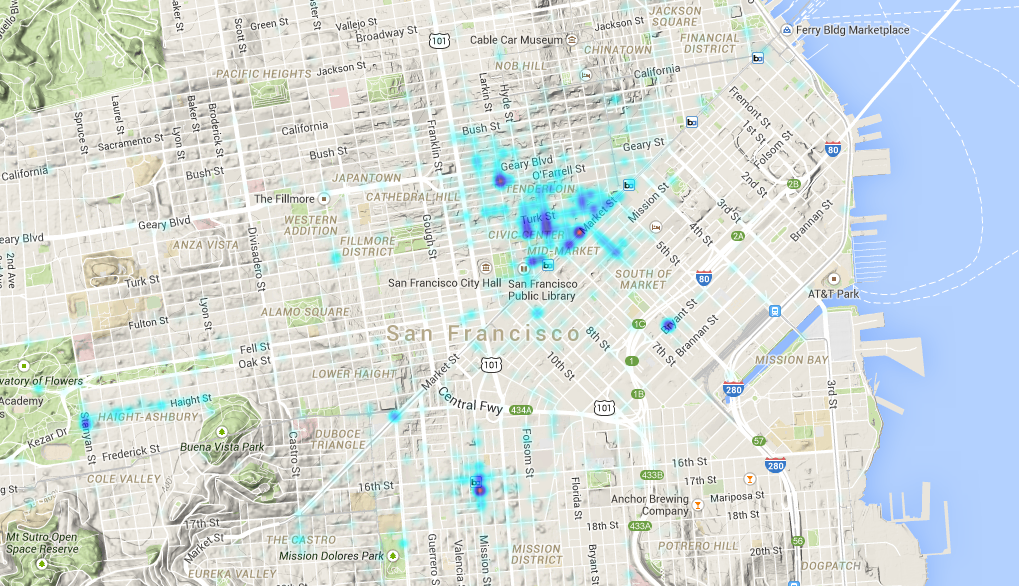
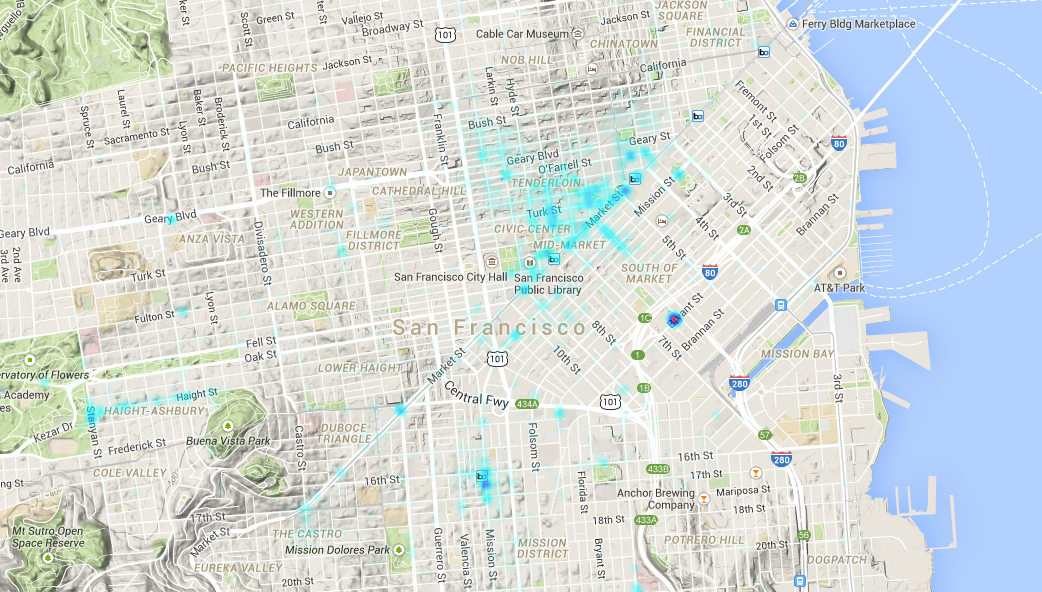
In this post I look into Chicago Police Department’s enforcement of two particular narcotics report types: Heroin and Crack Cocaine. I was curious to see yearly migrations of CPD’s activity from 2003 to 2014 in the west side region of Chicago.

heroin and crack molecule

The Data is from City of Chicago Data Portal

Links to youtube video animated heatmaps (some mobile devices don’t support embedded videos on my site):
http://www.youtube.com/watch?v=2qGPhlBGWxQ
http://www.youtube.com/watch?v=uh22pGBLgYo
http://www.youtube.com/watch?v=czoofaWOAps

Monthly

Yearly


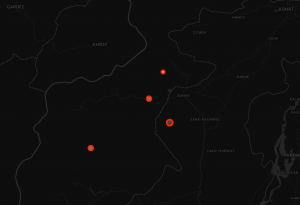
Ruby was used to parse the data and convert into JSON.
Google Heatmaps API was used to generate the maps.
Camtasia Studio 8 was used to annotate and export the videos.

Ruby written to create monthly maps

RubyToCreateMonthlyMaps

Chicago, Cook County – Defense Department’s 1033 program charts.

The data was found on github here:
Military Surplus Gear

The charts below cover Chicago, IL, Cook County
gunart

 This chart displays Rifles and Pistols received by year.
riflespistols1033cookcounty

This graph shows most popular equipment items received from 2006 through May 2014.
AllEquipment


Ruby code used to parse and format the data.  Google charts was used to display it.
Ruby to Parse all equipment in cook county


Video: Ruby to Parse CSV data, and Visualize it within GoogleCharts – NFL Player Weight Averages by Draft Year

Fun with random data. Find, investigate, and plot.

I parse an NFL dataset, and visualize it in a GoogleCharts Column Chart.

nfldraftyear


The video above details the steps taken

  • Download NFL CSV data from reddit post
  • Open downloaded file with OpenOffice and notepad to check it out
  • Create an Aptana Ruby Project
  • Copy CSV data into a specific directory
  • Write Ruby code to: Read Each line of the csv file, Test by outputting each player name (3rd column)
  • Figure out what to chart
  • Find specific columns within the dataset (Weight, draft_year)

Ruby:

  • Adjust ruby code to get columns, confirm for integrity
  • Create variables for weight and draft year
  • Create Hash’s for Counts and Averages
  • Populate the year hash count variable as you iterate through each row:
  •         – If the year hash count variable doesn’t have a year, create a new hash entry, specifying the year as the key, and setting the initial value to 1
  •         – If the year hash count variable already contains a key with the next row’s year, then get its value, increment it by 1, and update the pair.
  • Do the same thing for the weight averages hash, only with weight. Accumulate weight totals for each year.
  • cast weight and draft year variables into integers
  • iterate through year count hash.
  • Create new has with year and weight averages hash.
  • Perform calculations on each pair in year hash count. Cast pairs into float types, divide weight accumulated totals, by counts.
  • Sort new hash
  • output the contents of new hash.
  • fix mistakes.

Google Charts html formatting:

  • Obtain a Column Chart from GoogleCharts and save it locally as an html.
  • Adjust example properties with note pad.

Ruby:

  • Adjust output into appropriate JSON
  • Enjoy your chart.

DataViz: Visualizing Chicago Narcotics Crime Data.

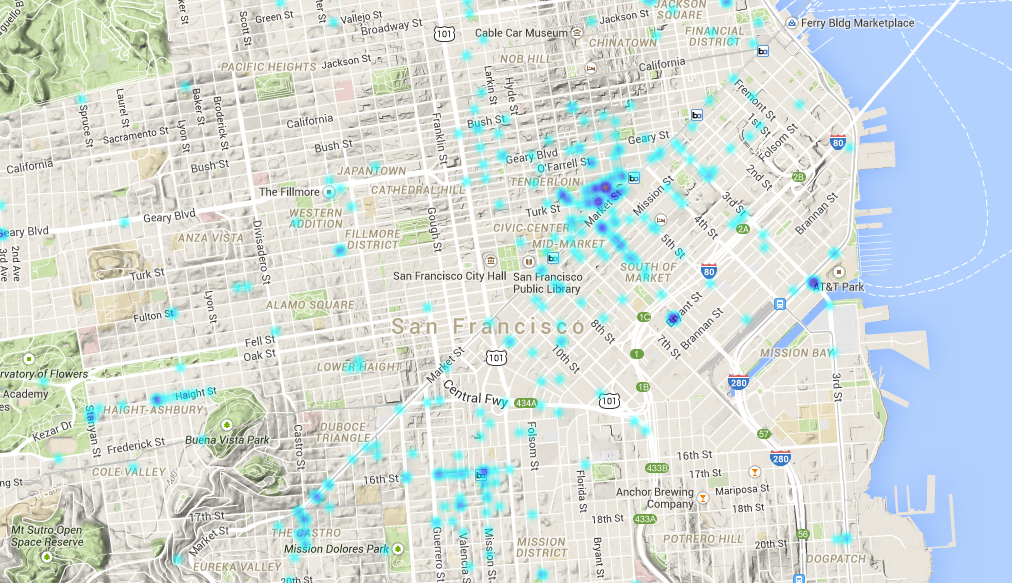
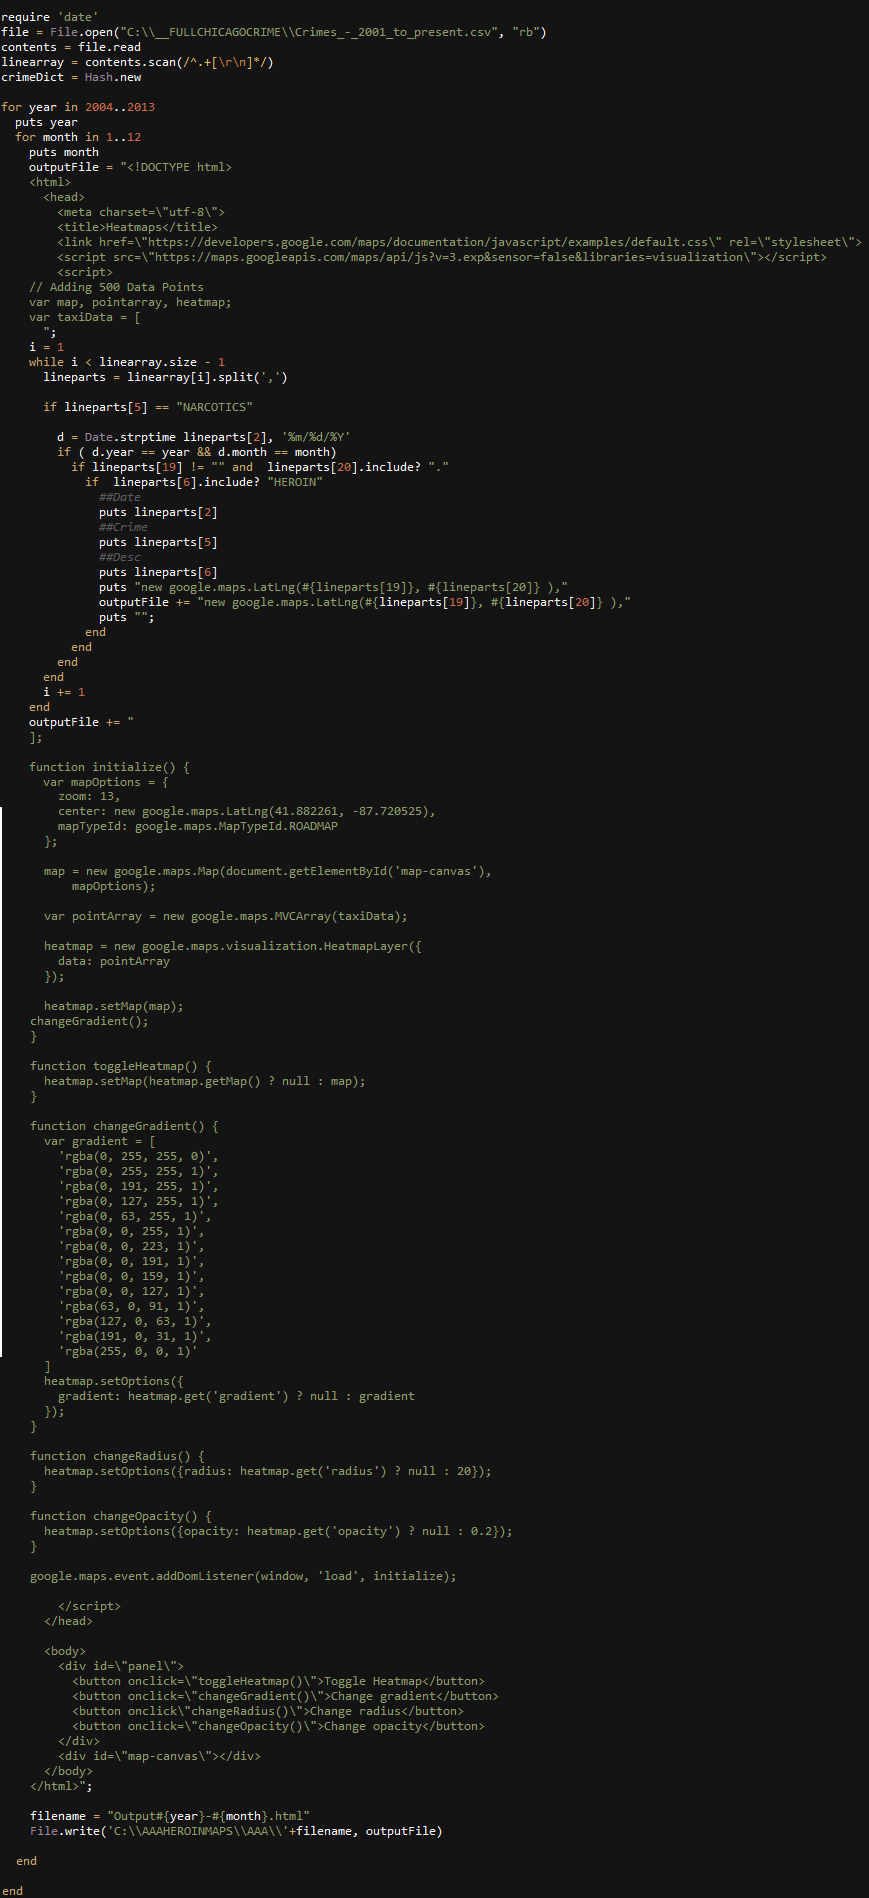
In this post, I will give a semi-detailed overview of how to make an animated heat map over a time range.  This is my first attempt at making an animated heat map.

I will be revisiting Chicago crime statistics from City of Chicago Data Portal 2001-2013

This dataset reflects reported incidents of crime (with the exception of murders where data exists for each victim) that occurred in the City of Chicago from 2001 to present, minus the most recent seven days.Data is extracted from the Chicago Police Department’s CLEAR (Citizen Law Enforcement Analysis and Reporting) system. Read More about the dataset here

On 11/28/2013 I downloaded a csv from chicago’s data portal named Crimes_-_2001_to_present.csv, its size was 1,050,688 KB

Here is an example of how I would parse out all coordinates of narcotics violations for the month of January in 2013.
rubyspecific

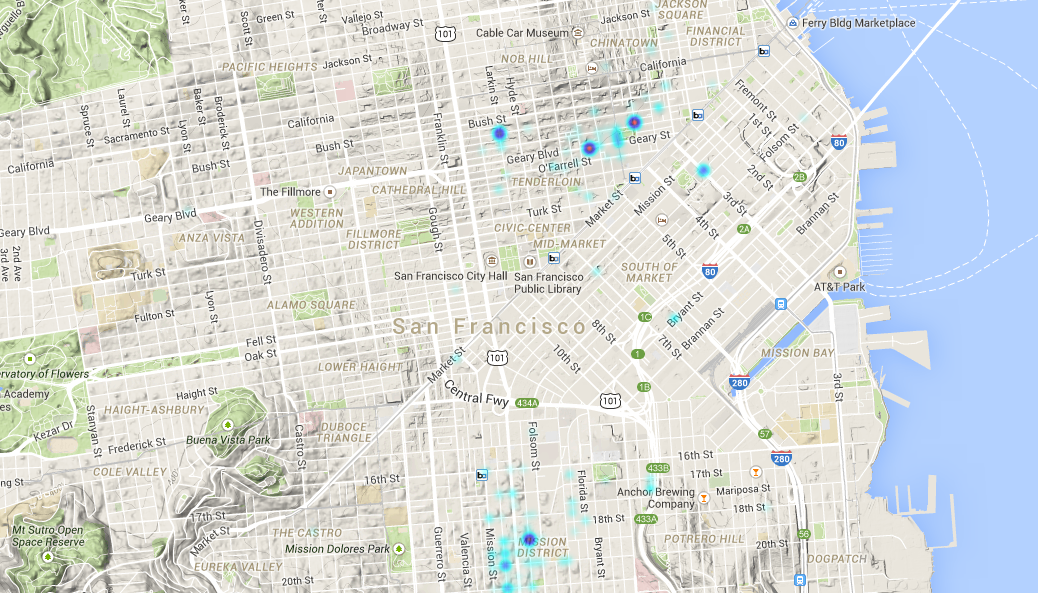
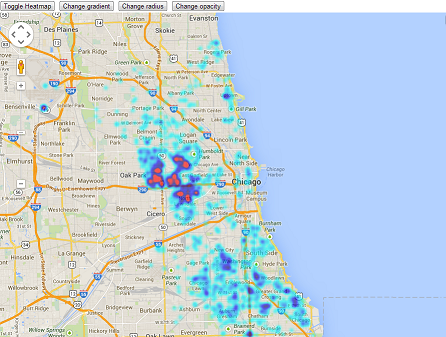
Lets test the coordinate outputs by appending them into a google maps heatmap.
SingleMonthTest

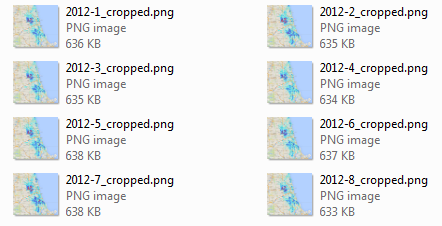
Okay, now I’m going to manually make one of these images (with static center and size) for each month from January 2012 to October 2013. Next, I wrote a quick c# application using ImageMagick to programmatically crop each Browser screenshot.

string[] files = Directory.GetFiles(@"c:\__FULLCHICAGOCRIME\Months\ScreenShots");
foreach (string file in files)
{
    string ext = Path.GetExtension(file);
    if (ext == ".png")
    {
        string filenameNoExt = Path.GetFileNameWithoutExtension(file);
        string filenameExt = Path.GetFileName(file);
        Directory.CreateDirectory(@"c:\ImageConversion\" + filenameNoExt);
        Process imProcess = new Process();
        string im_command =  file + @" -crop 800x800+500+300 c:\__FULLCHICAGOCRIME\Months\ScreenShots\cropped\" + filenameNoExt + "_cropped.png";
        imProcess.StartInfo.UseShellExecute = false;
        imProcess.StartInfo.RedirectStandardOutput = true;
        imProcess.StartInfo.FileName = @"c:\__FULLCHICAGOCRIME\Months\ScreenShots\convert";
        imProcess.StartInfo.Arguments = im_command;
        imProcess.Start();
        imProcess.WaitForExit();
    }
}

Now I have the frames for my animation.
croppedimages

Lastly, I append all these images into a movie using Windows Movie Maker, and add some Beethoven as background music.