
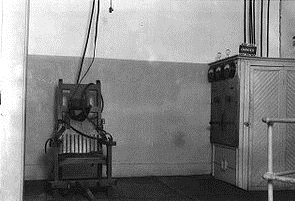
A look into death row inmates of Texas, USA.
The data is from https://github.com/zmjones/deathpenalty
Which is put together from Texas Department of Criminal Justice
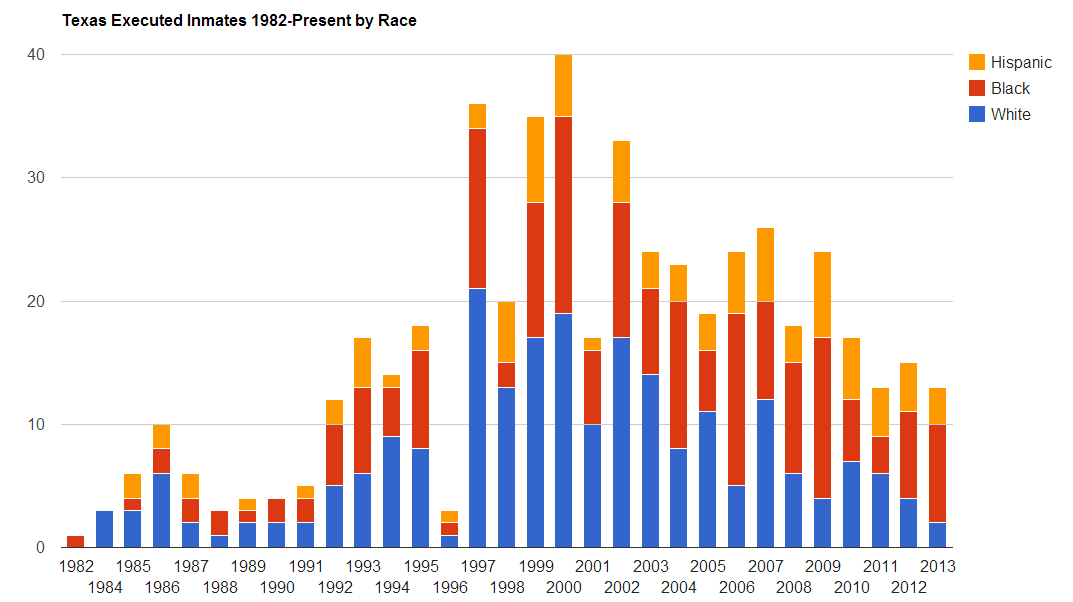
Year by Race Stacked Bar Chart:
Year by Age Scatter Chart:

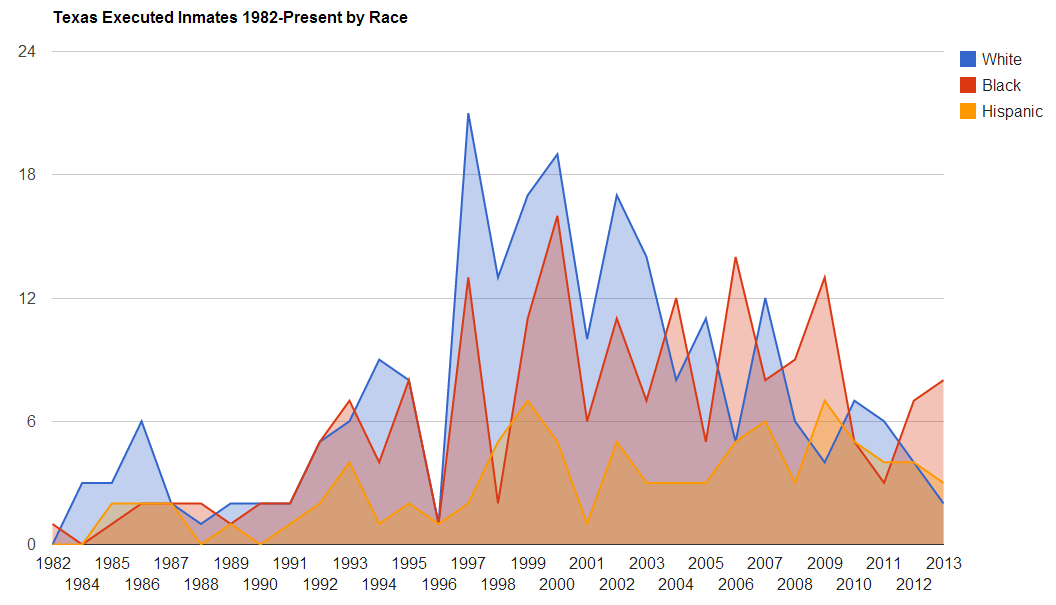
Year by Race Area Chart:
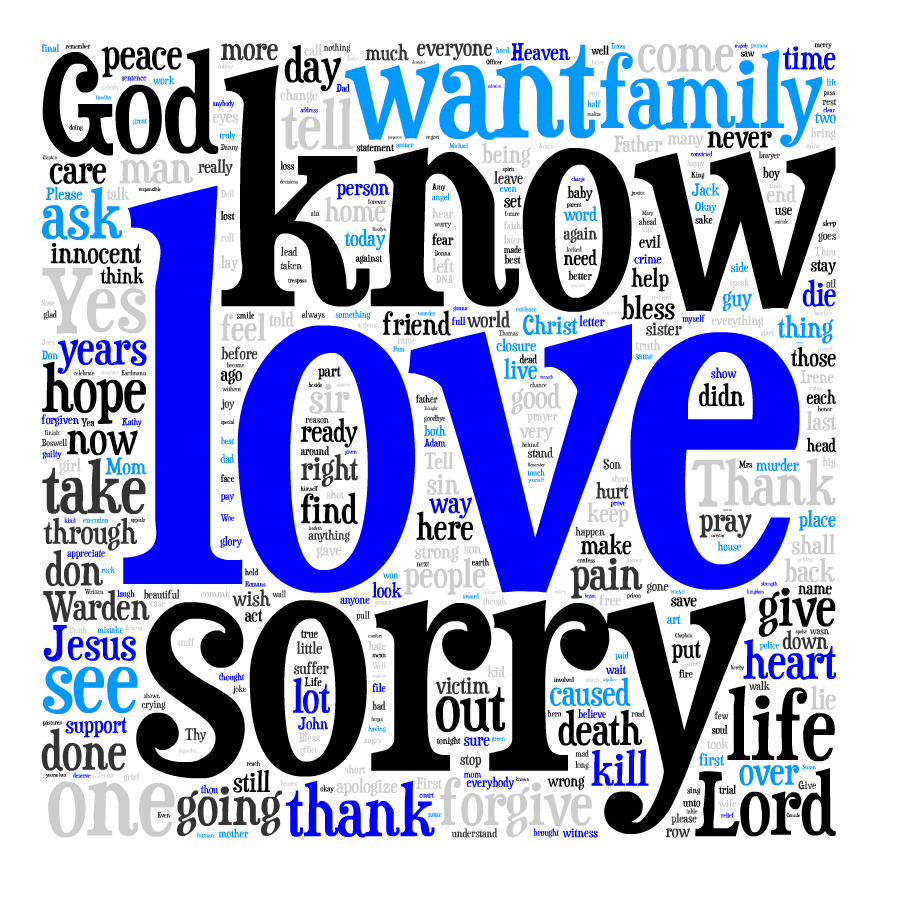
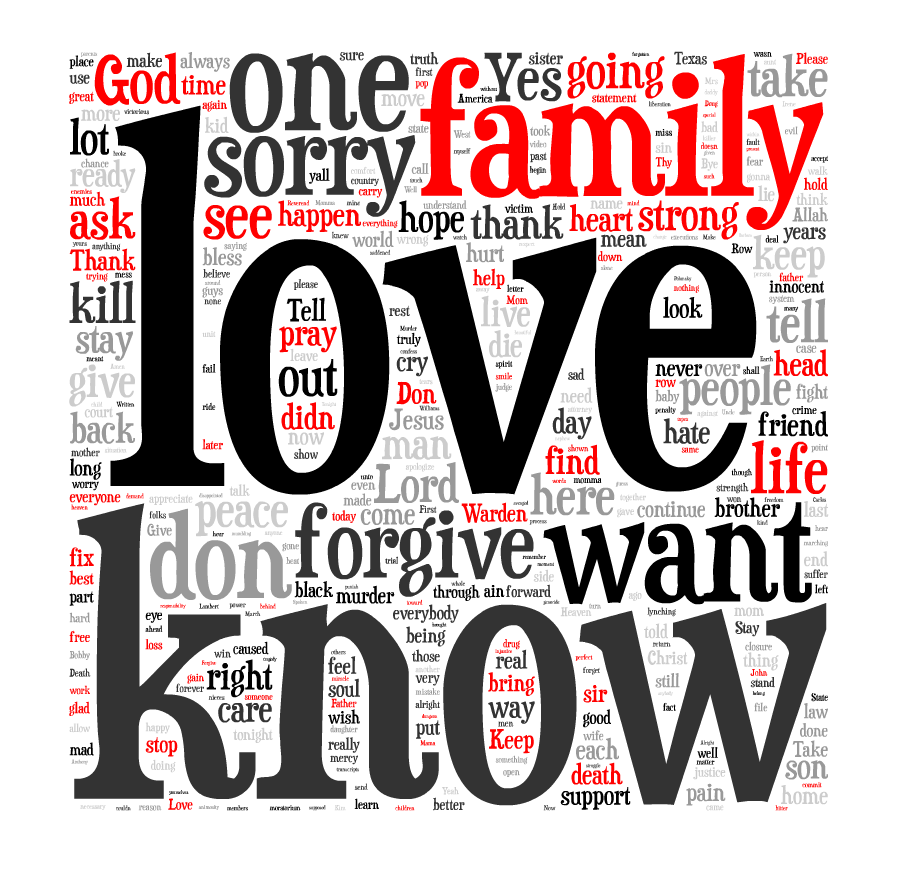
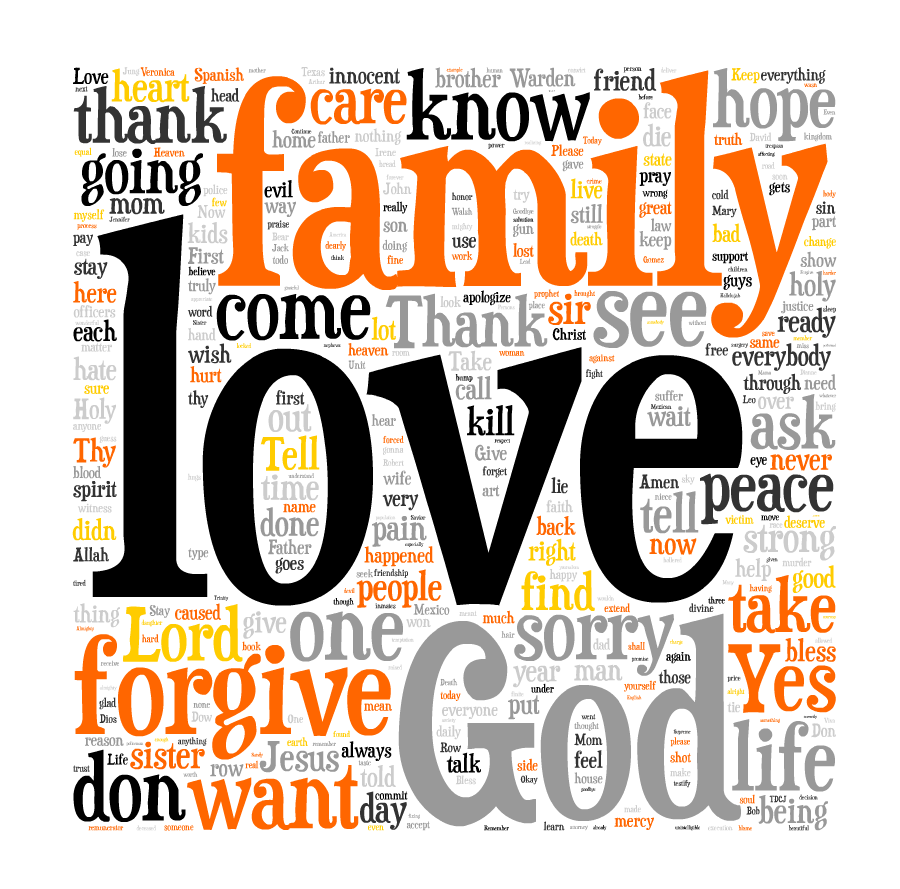
Last Words – Word Cloud generated by Tagul. Click to enlarge
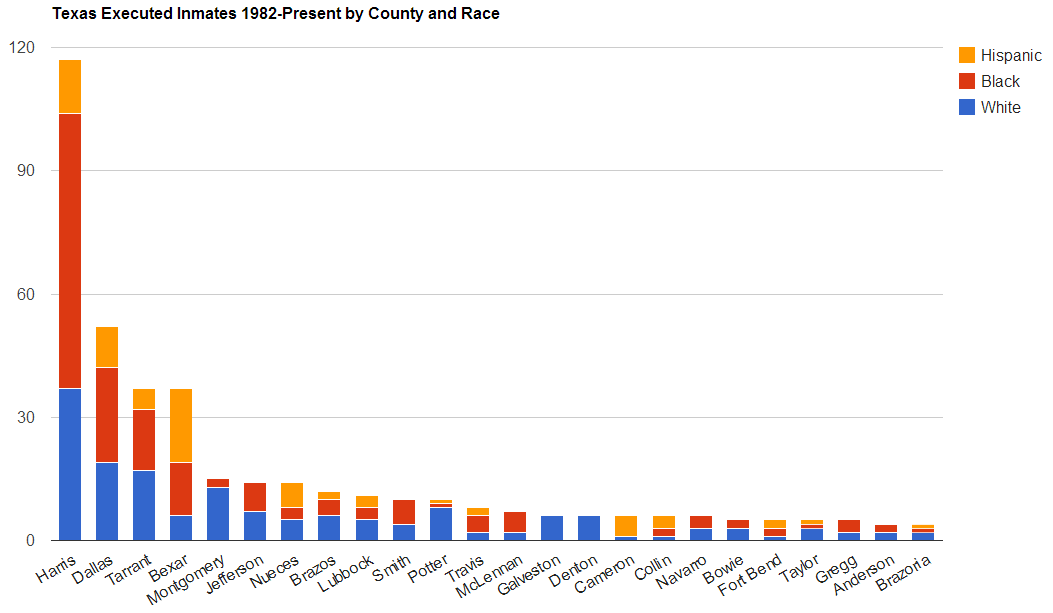
By County over 5
Ruby Used for Scatter Chart:
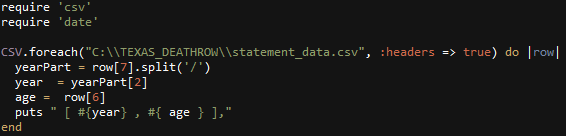
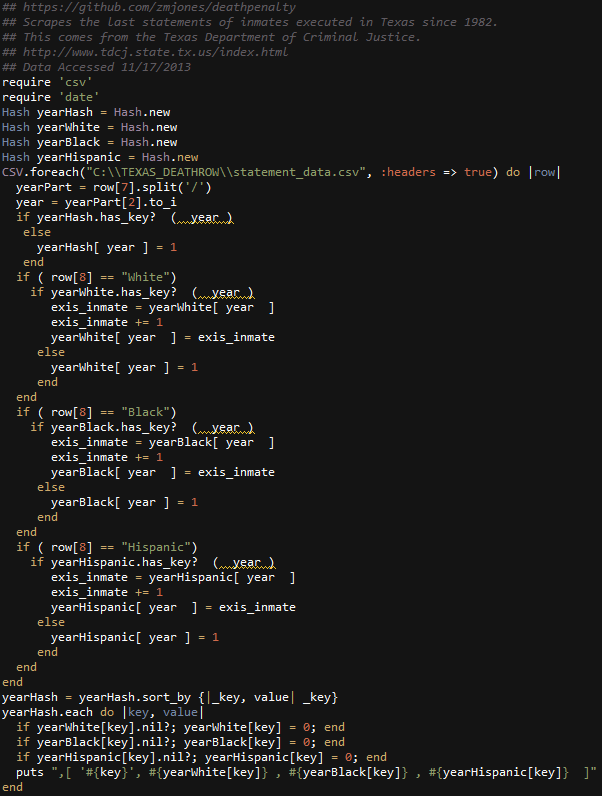
Ruby Used for Stacked Race By Year:
The wordclouds of last statements are really nice. Seeing “learn” as one of the smaller ones is chilling. It makes sense considering that there isn’t much time left for learning.
“Sorry” and “innocence” being more frequent (at least on a relative basis) for whites is a bit inconsistent.