Winforms c# application animating the daily market values of The Coca-Cola Company with piano emphasis.

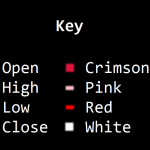

Winforms c# application animating the daily market values of The Coca-Cola Company with piano emphasis.
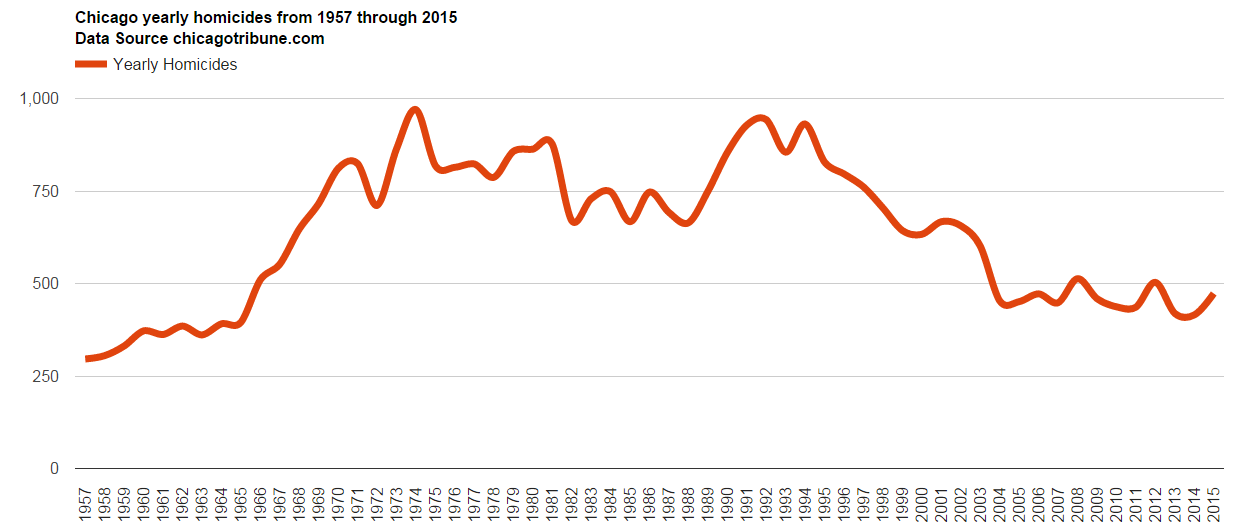
A quick and fun response to a data visualization request submitted to Reddit. The dataset provided comes from chicagotribune.com, and contains monthly homicide counts from 1957 through 2015. Click on graphs below for larger size.
Total Yearly 1957 – 2015
Monthly lines emphasizing warmer vs colder months. “Suns out, guns out.”

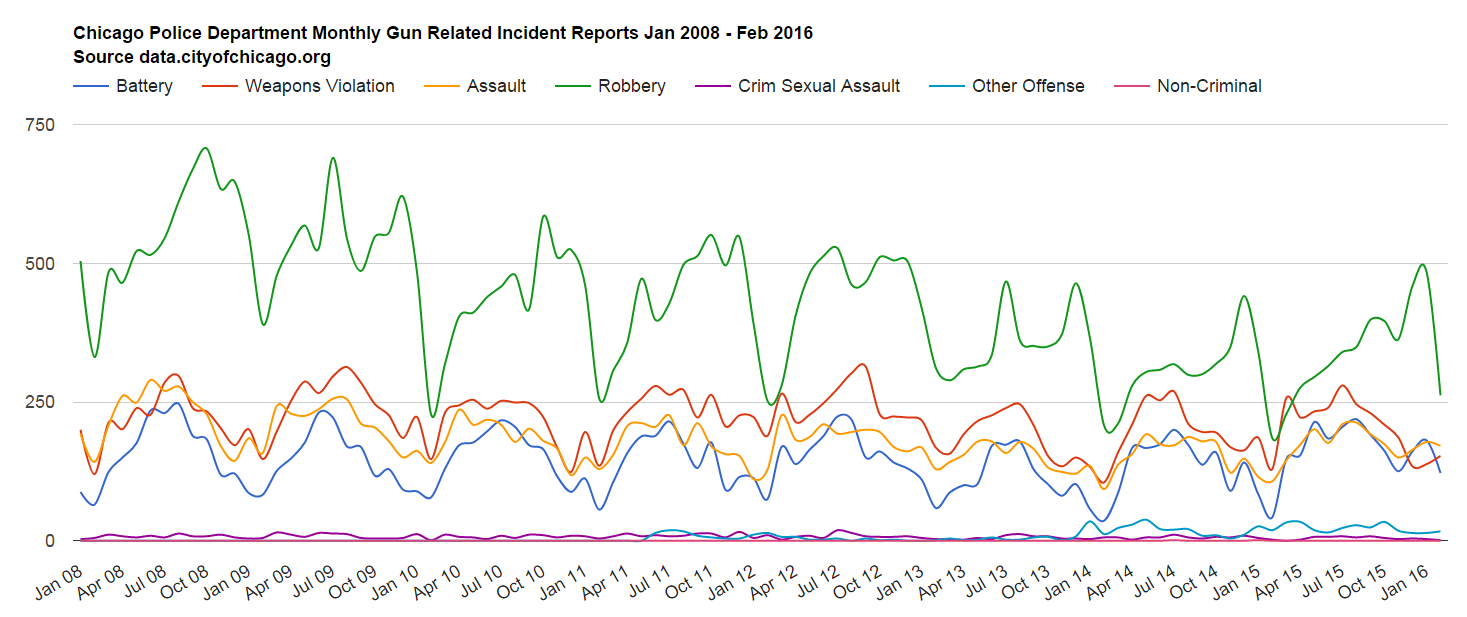
A look into Chicago Police Department’s gun related incident reports from January 2008 through February 2016. The data is from data.cityofchicago.org.
Stacked bar chart of monthly incidents by primary type.
Click chart image to expand

Line chart of monthly incidents by primary type.
Click chart image to expand
Static Map


Animated Map
Continue reading
Playing around with the MapD demo. In order to show off their plotting speed capabilities, they provide a sample set of twitter geo data to view on an web based interactive world map. Time range of tweets displayed is from Nov,1 2014 through Feb 28, 2015. I don’t know how inclusive the tweet data is, and what percentage of the total tweets this sample contains.
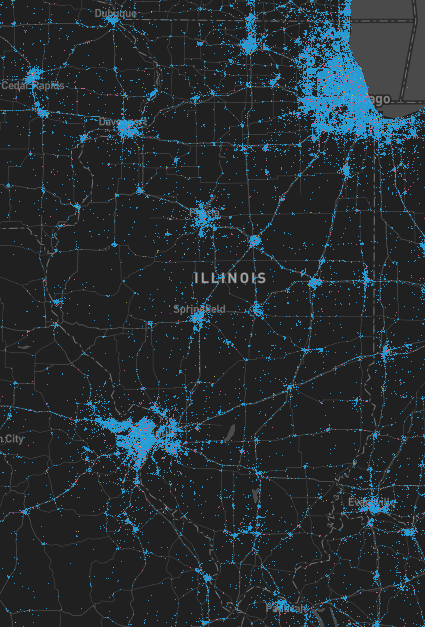
Here are some screenshots I took of Tweets made from Illinois to Chicago.

Another look into Baltimore’s open data. Time Range ~5 Years worth of BPD Part 1 Victim Based Crime Data. Only weapon values for knife and firearm were included.
Big satellite map with labels [2301×2402] pixels

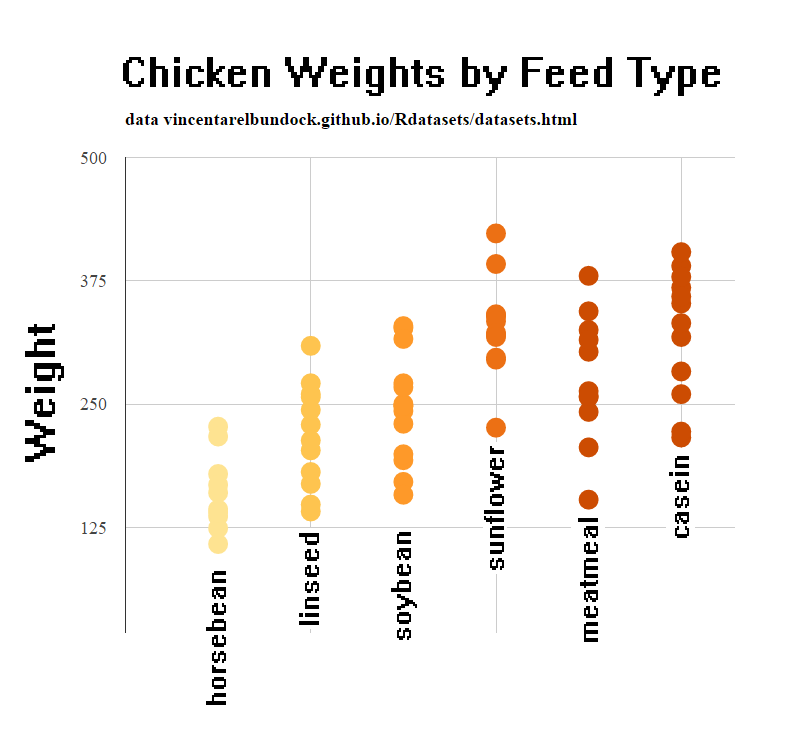
Feeding chickens different foods. Data from https://vincentarelbundock.github.io/Rdatasets/datasets.html
Newly hatched chicks were randomly allocated into six groups, and each group was given a different feed supplement. Their weights in grams after six weeks are given along with feed types.
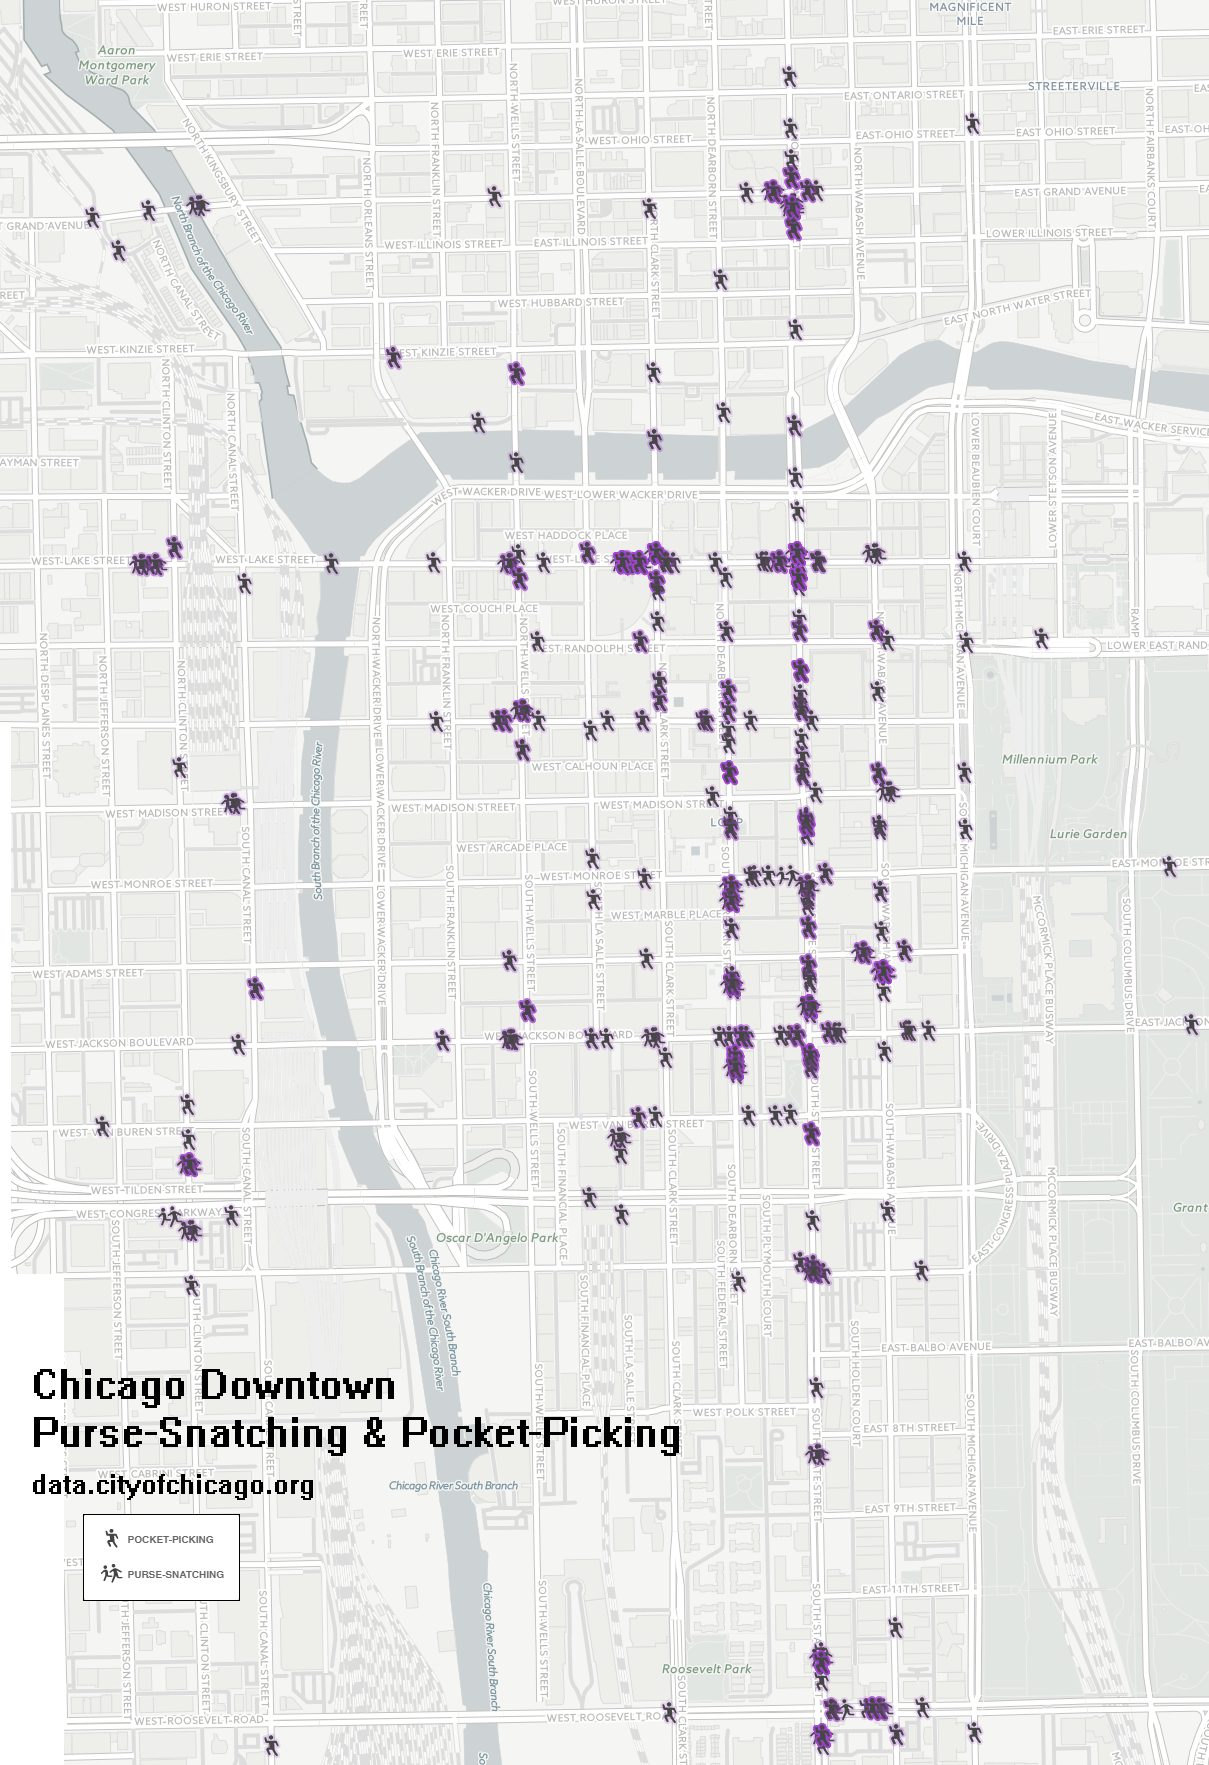
A look into the primary crime type of theft, filtered by Purse-Snatching and Pocket-Picking. The data is from data.cityofchicago.org.

Click map for full size.
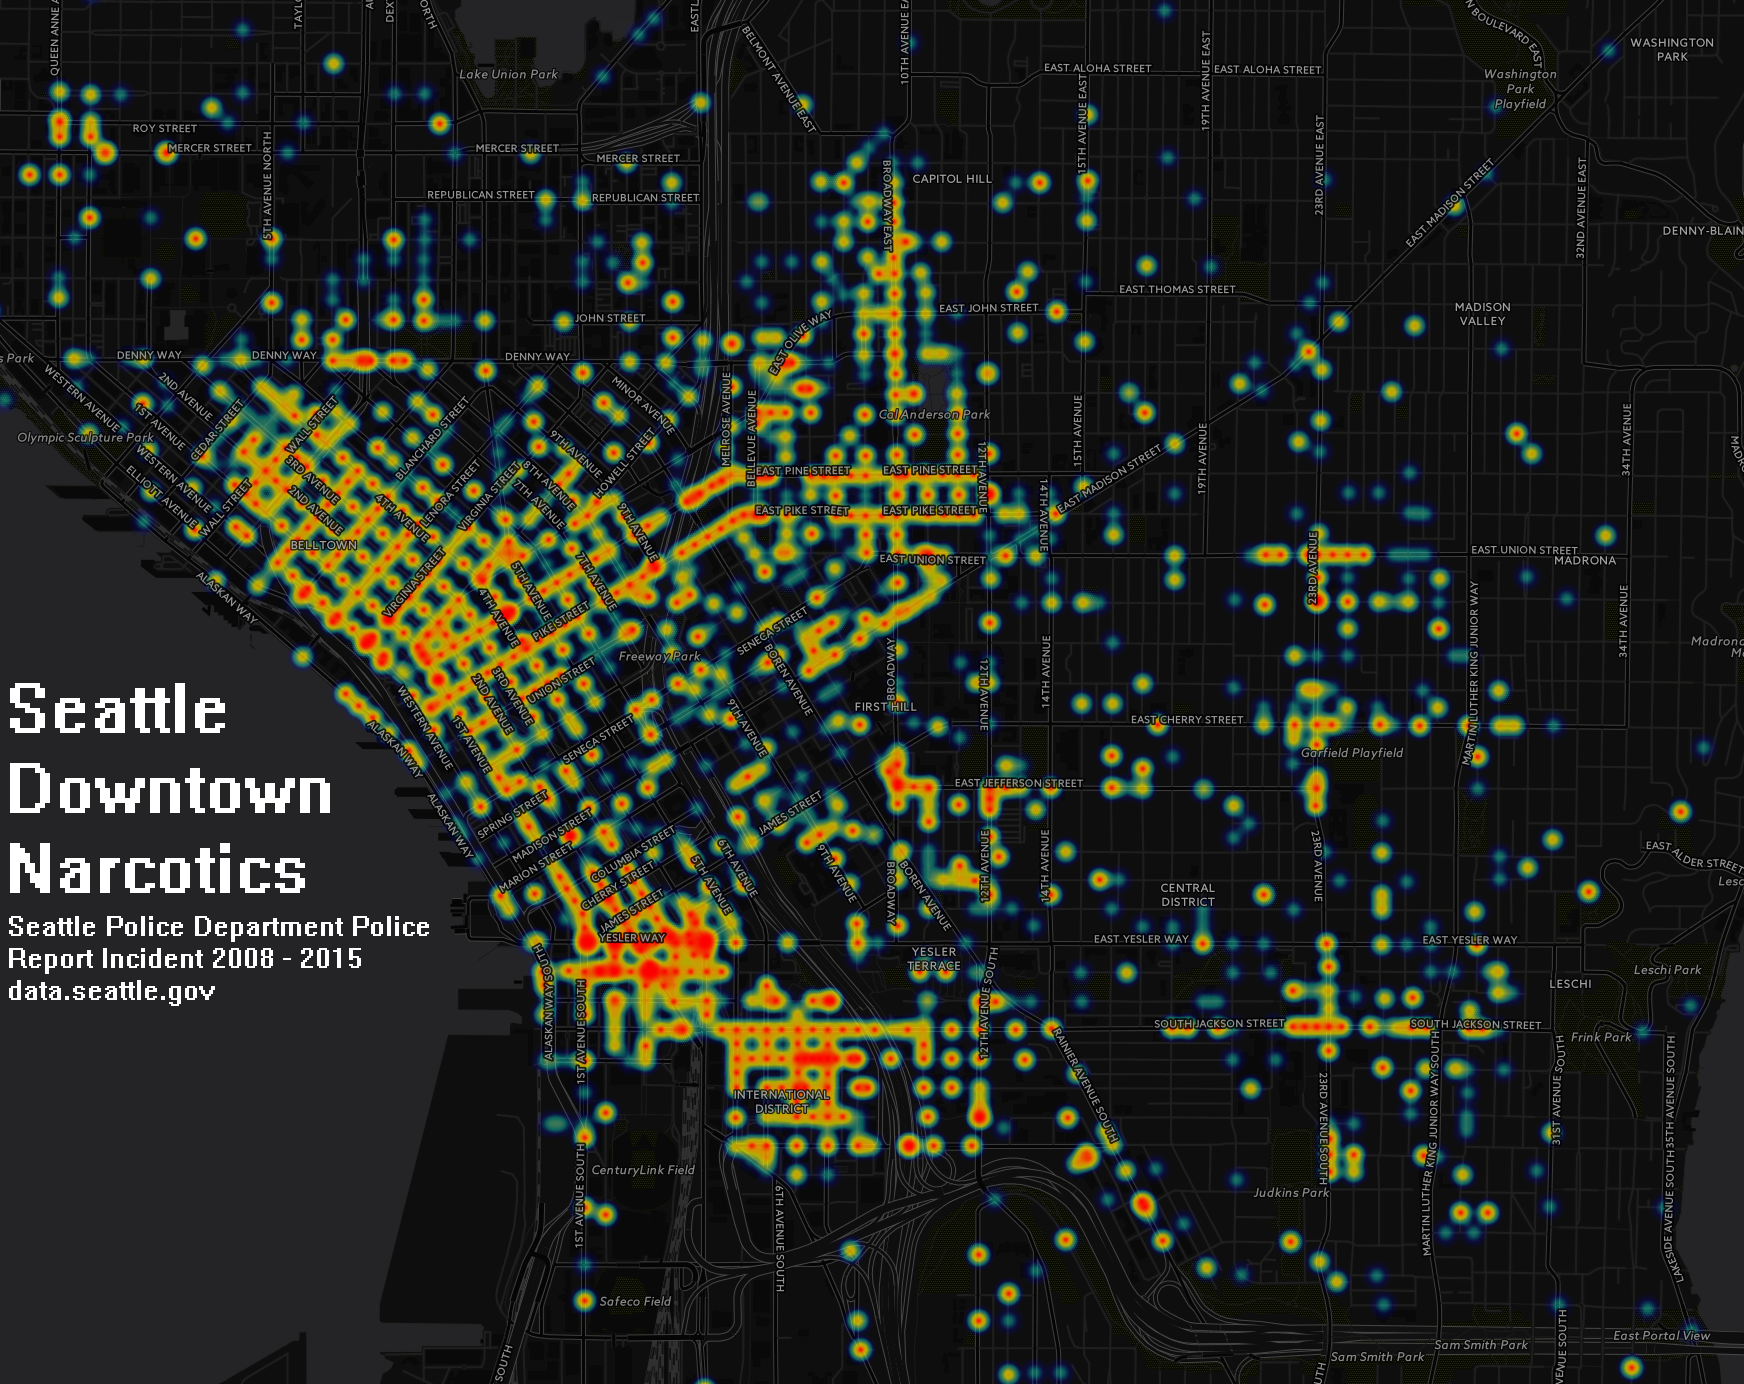
A look into Seattle Police Department Incident Reports. The data covers incidents from 2008 through 2015, it was filtered by offence types.

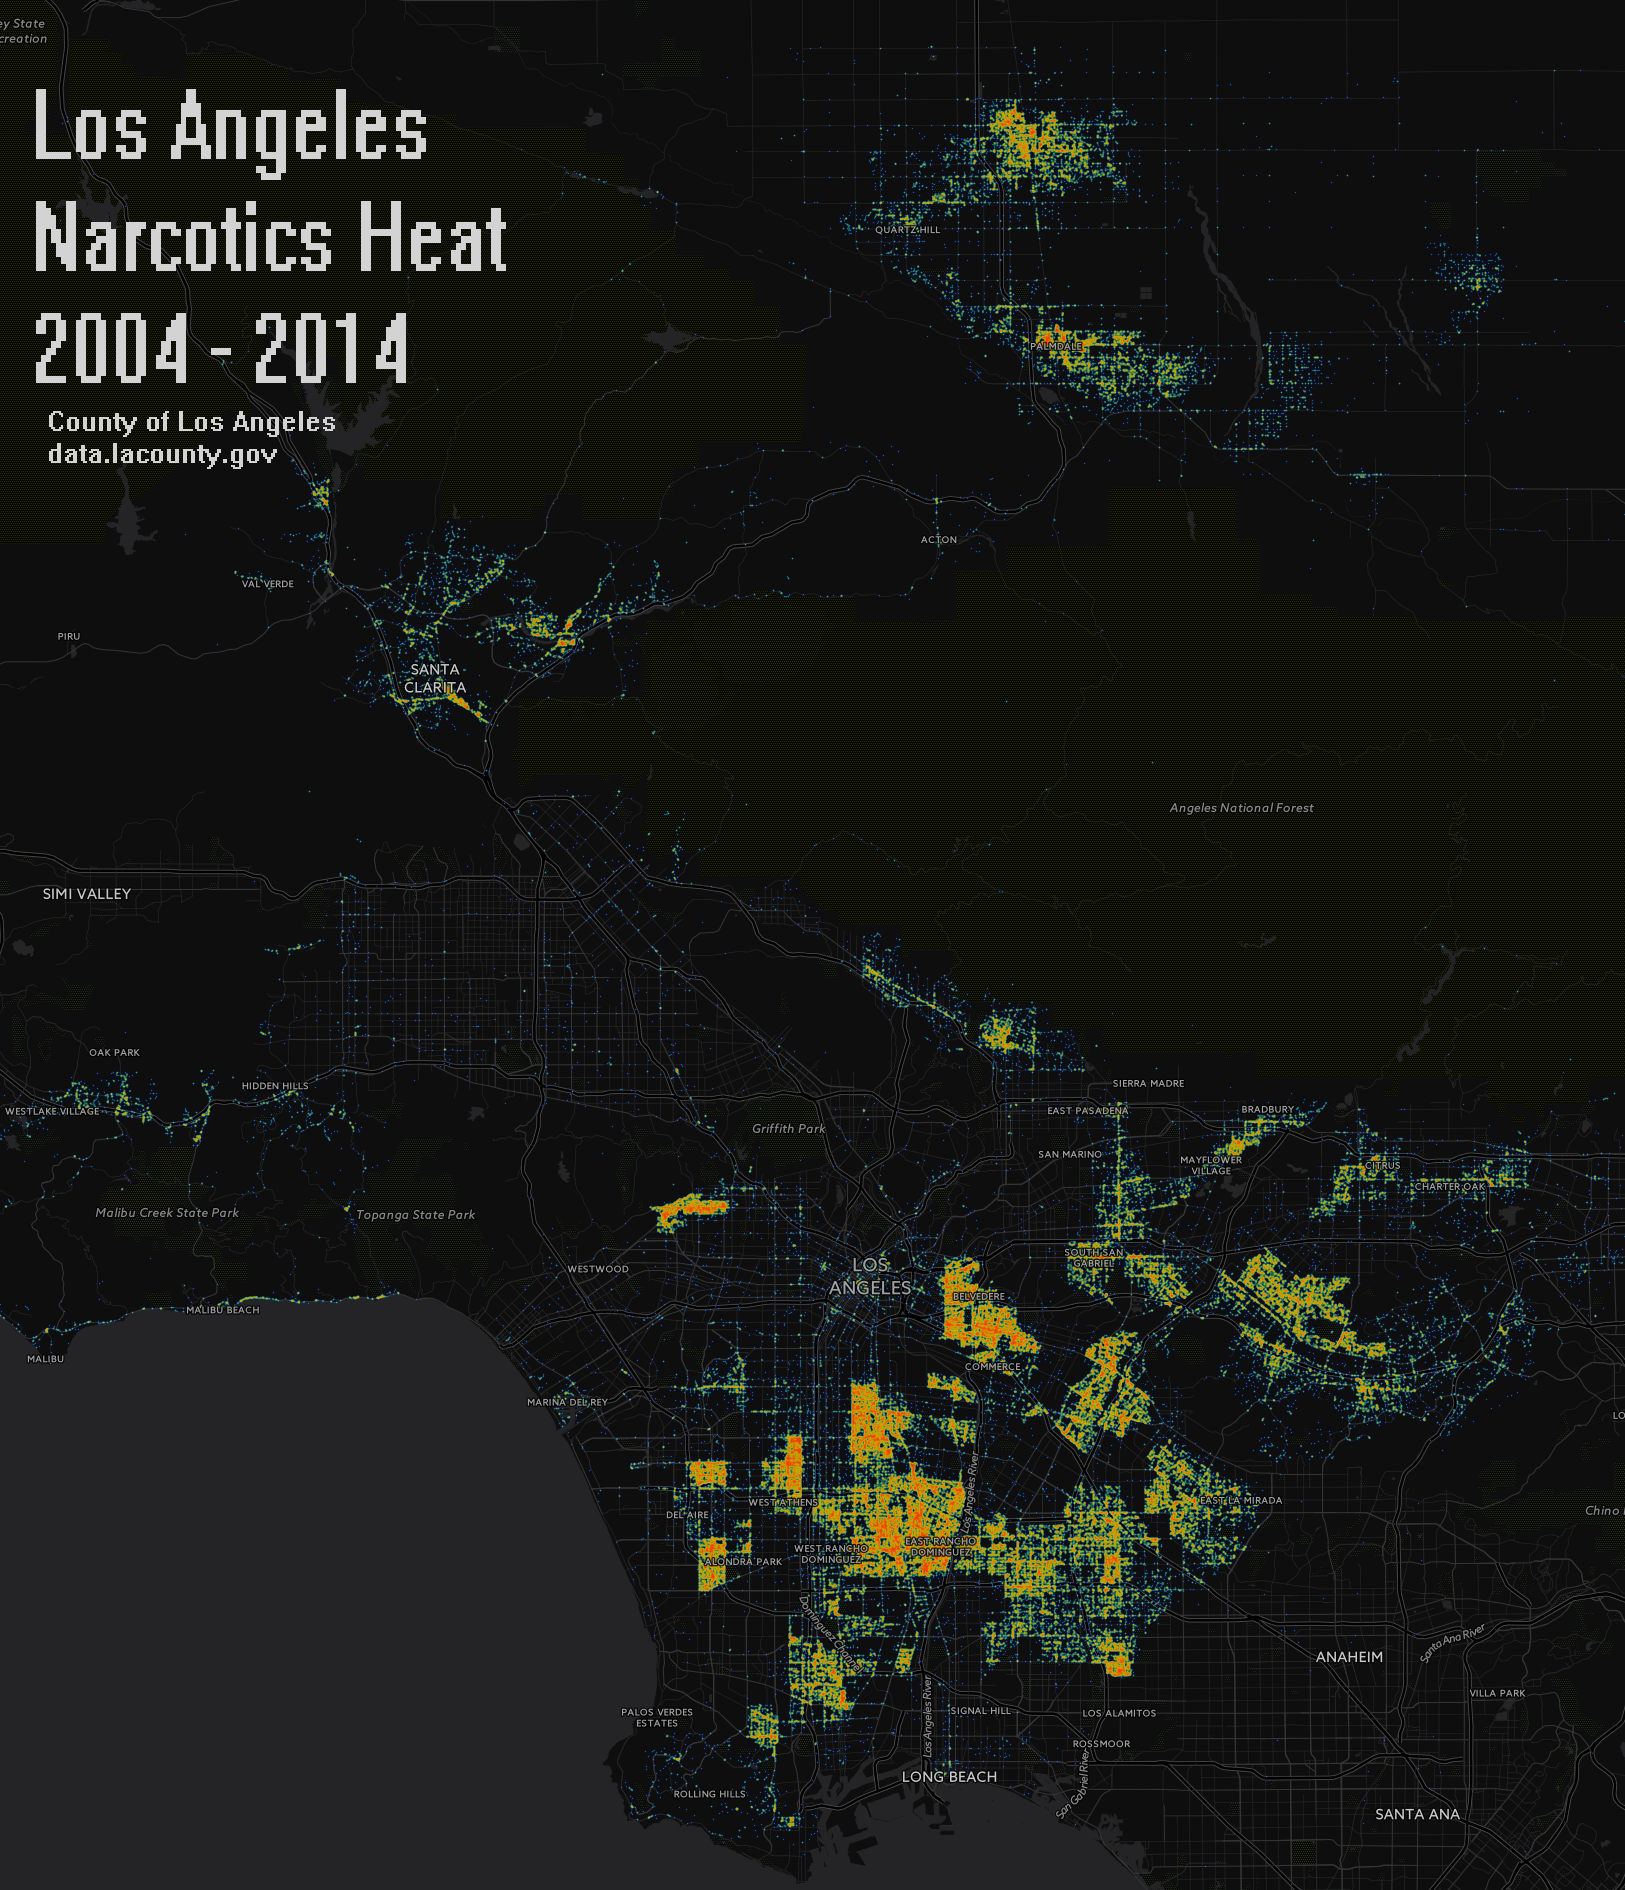
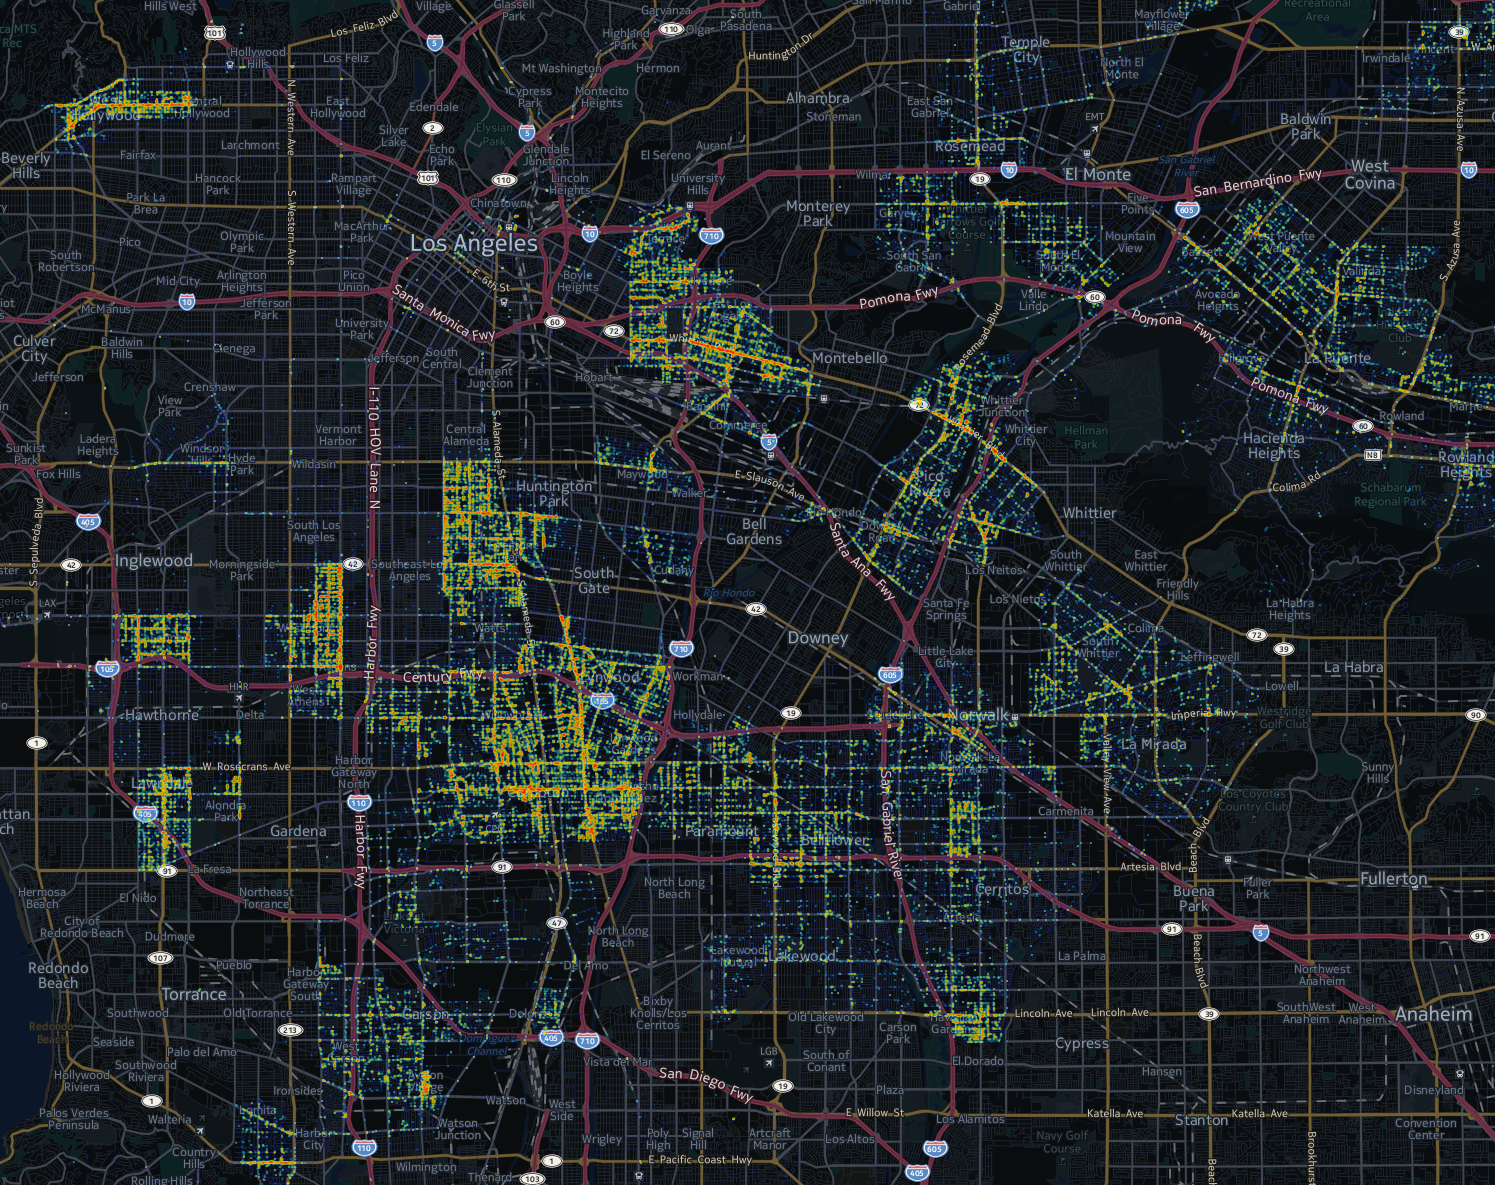
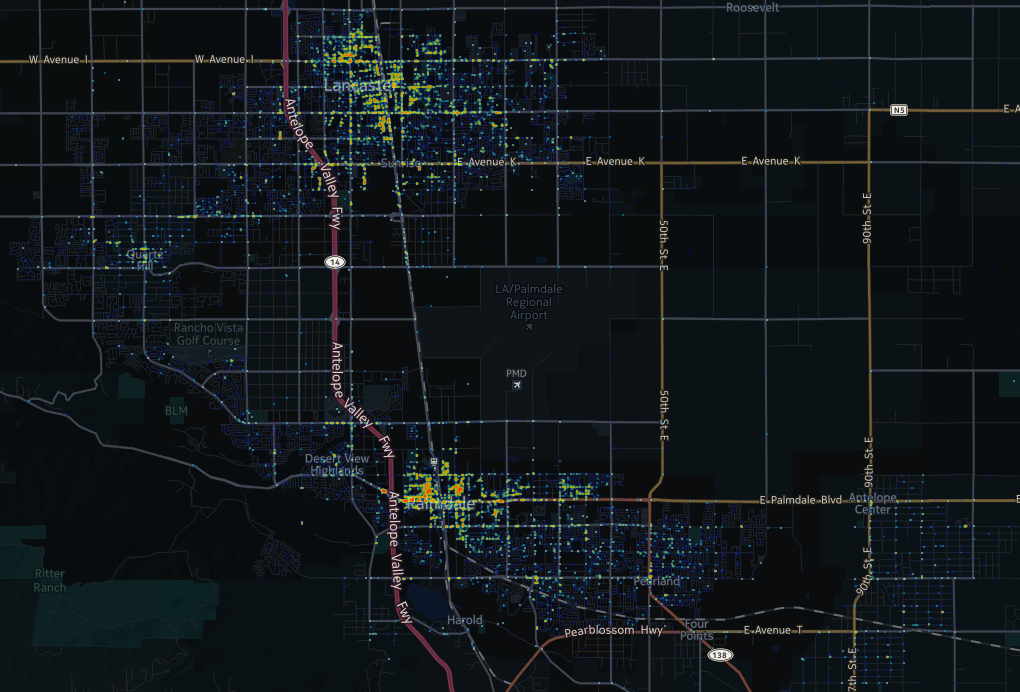
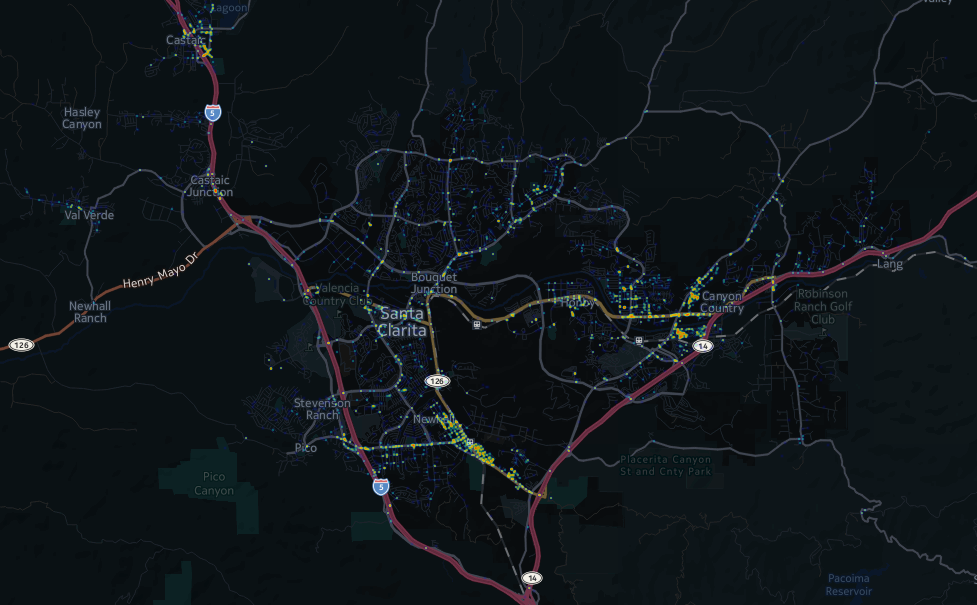
A look into narcotics crime reports from the LA Sheriff. The data used was filtered by the crime category description of Narcotics. Date Range was from 2004 through 2014. The data can be found on data.lacounty.gov
(Click on the images below for full size)
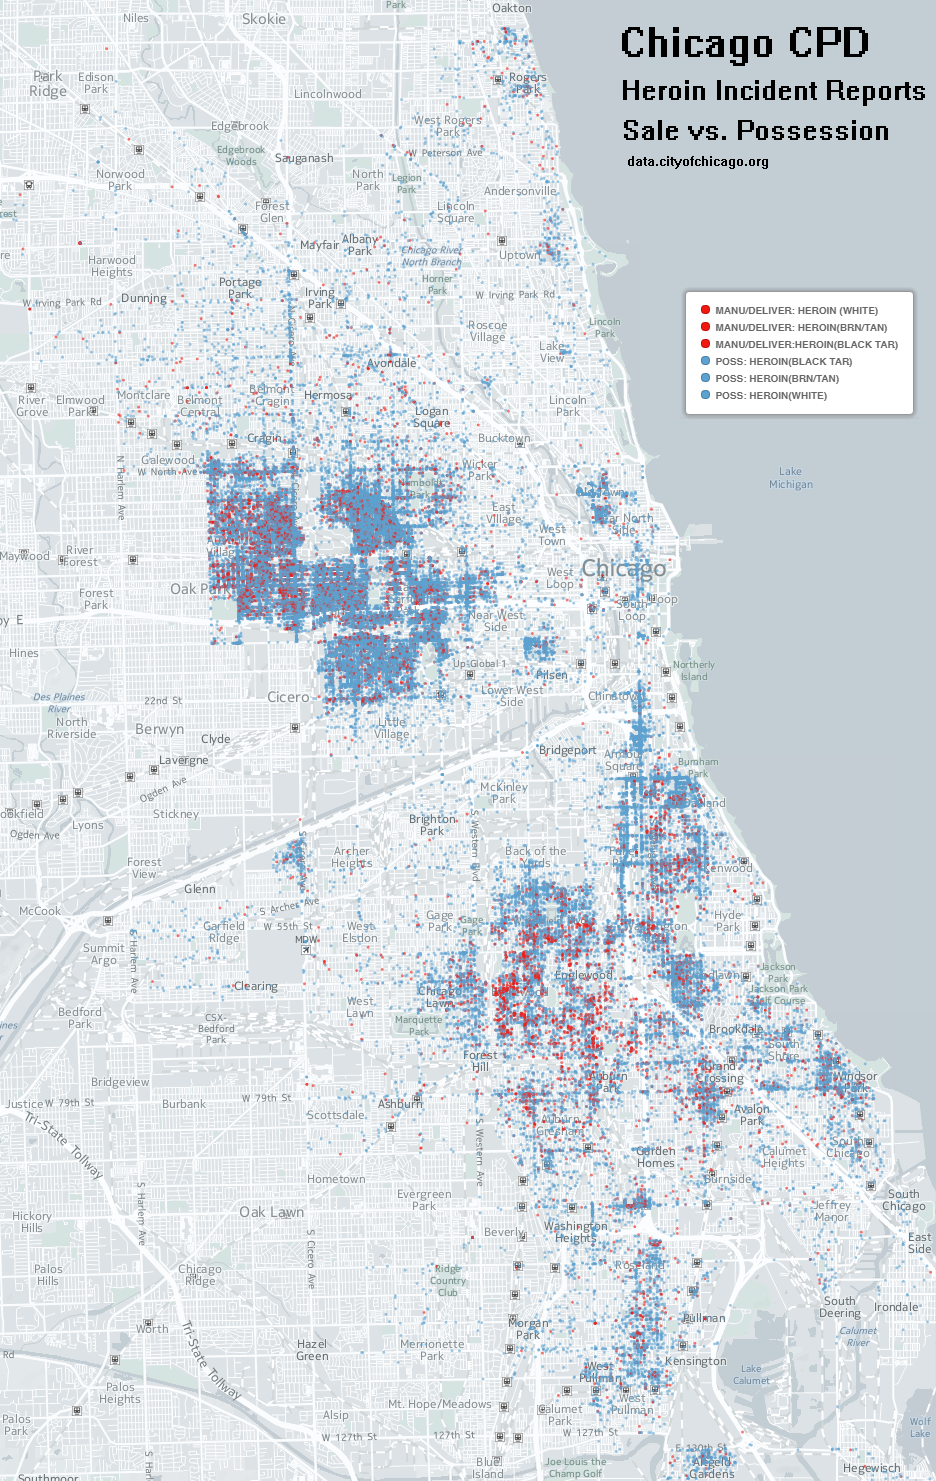
Comparing the difference between Sale vs. Possession within CPD heroin related incident reports.
The data is from data.cityofchicago.org
The following Narcotics descriptions were included in this comparison
Below are two static maps and a video (click for higher resolution).