
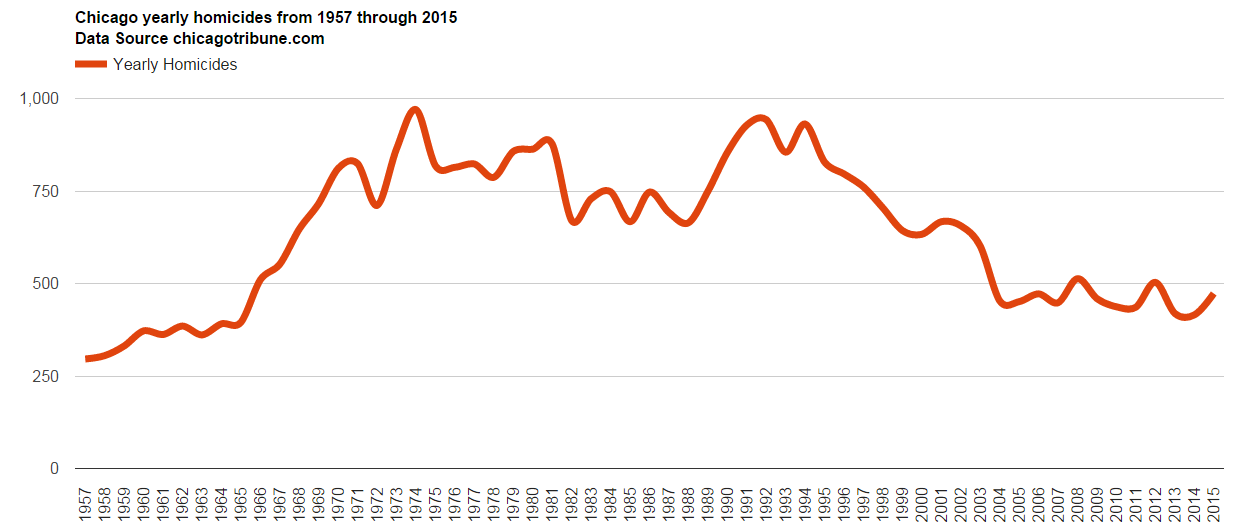
A quick and fun response to a data visualization request submitted to Reddit. The dataset provided comes from chicagotribune.com, and contains monthly homicide counts from 1957 through 2015. Click on graphs below for larger size.
Total Yearly 1957 – 2015
Monthly lines emphasizing warmer vs colder months. “Suns out, guns out.”
