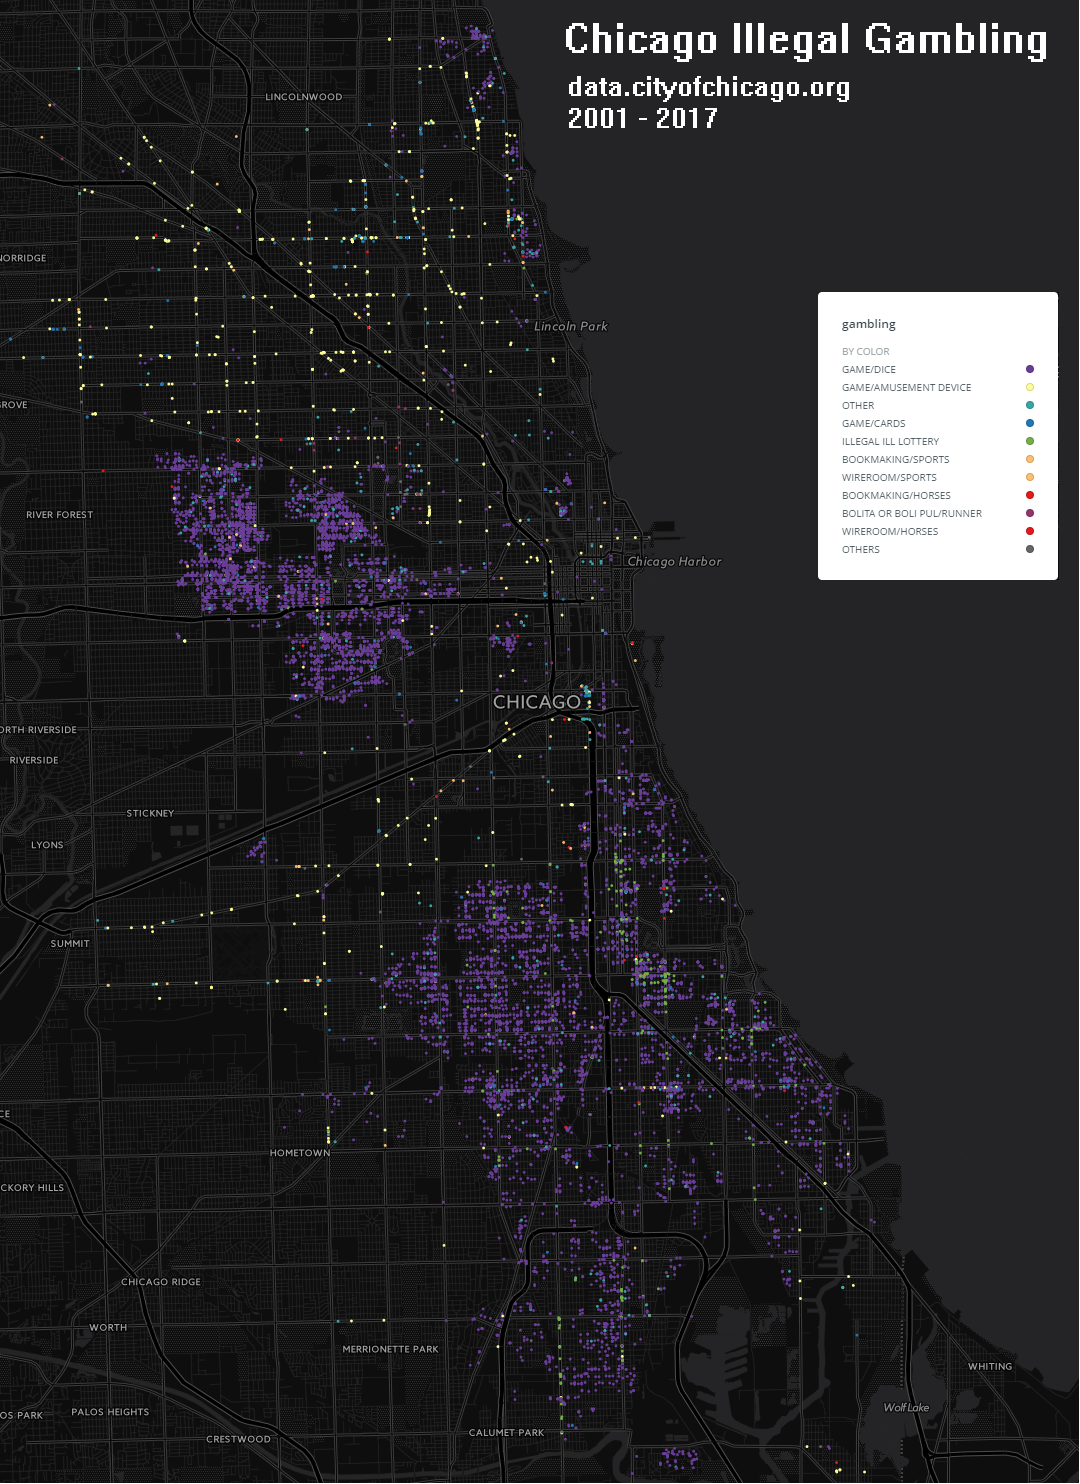
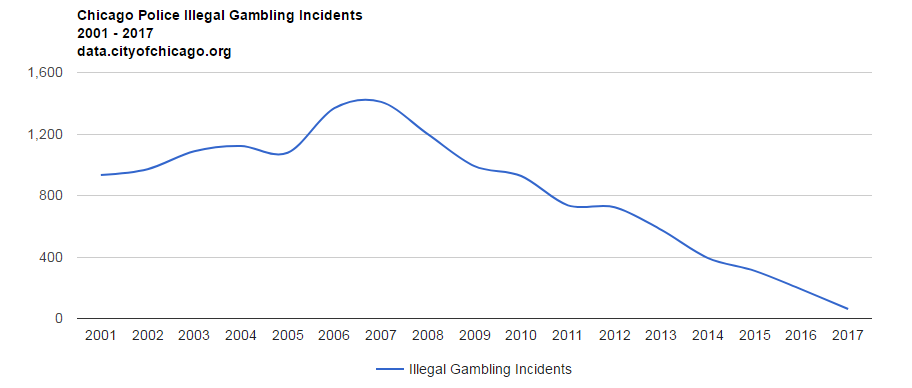
17 years of illegal gambling in Chicago.
A look into Chicago Police Department’s history of Gambling related incident reports. The data came from https://data.cityofchicago.org
Curious as to what caused the decline over the last 17 years. Are people gambling less, or are police enforcing less?
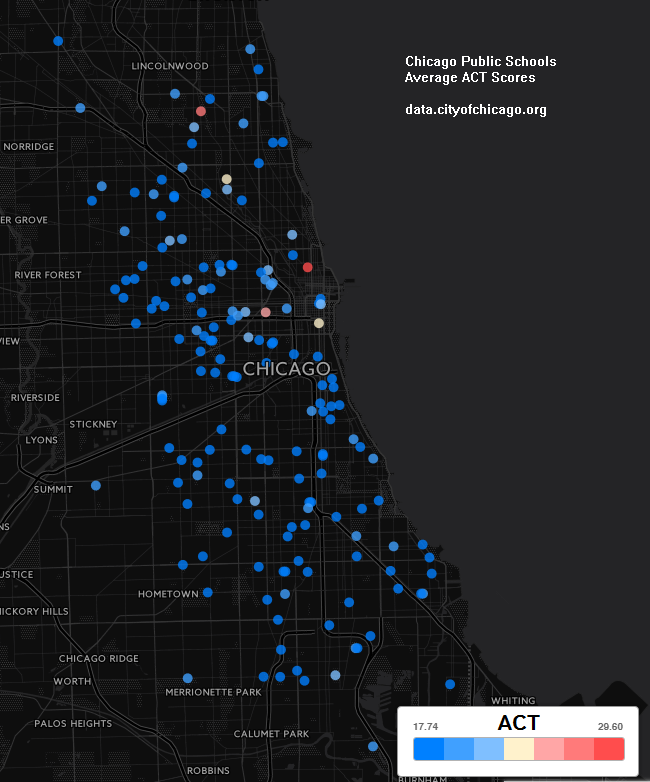
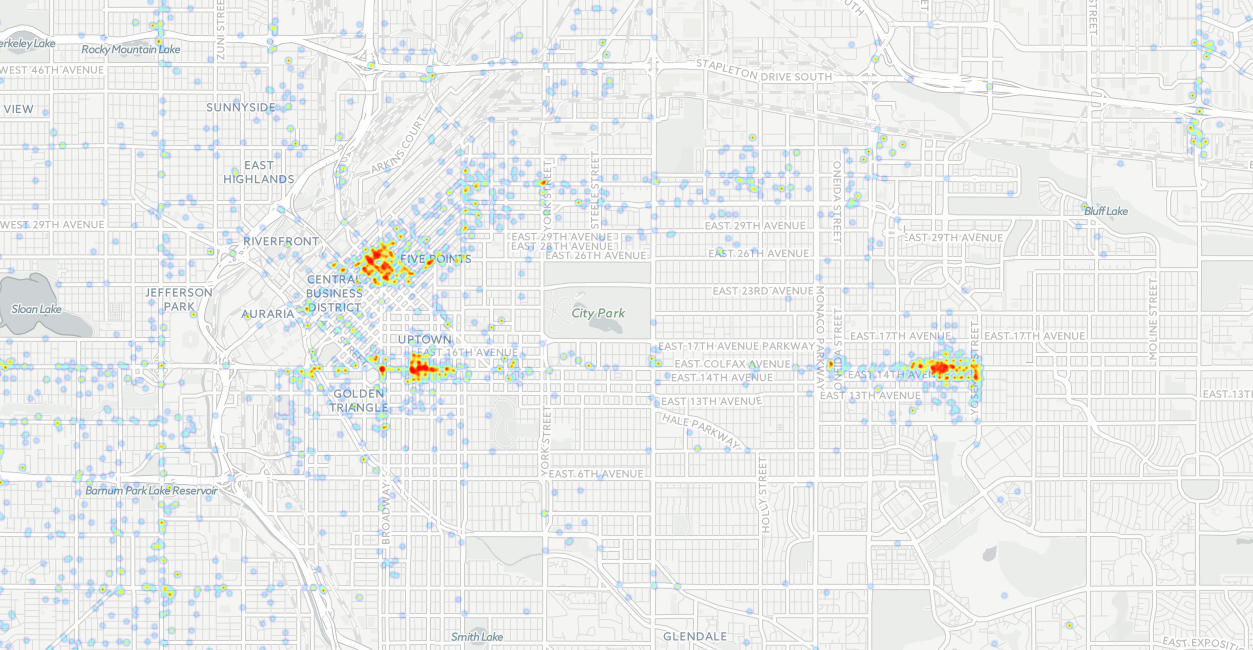
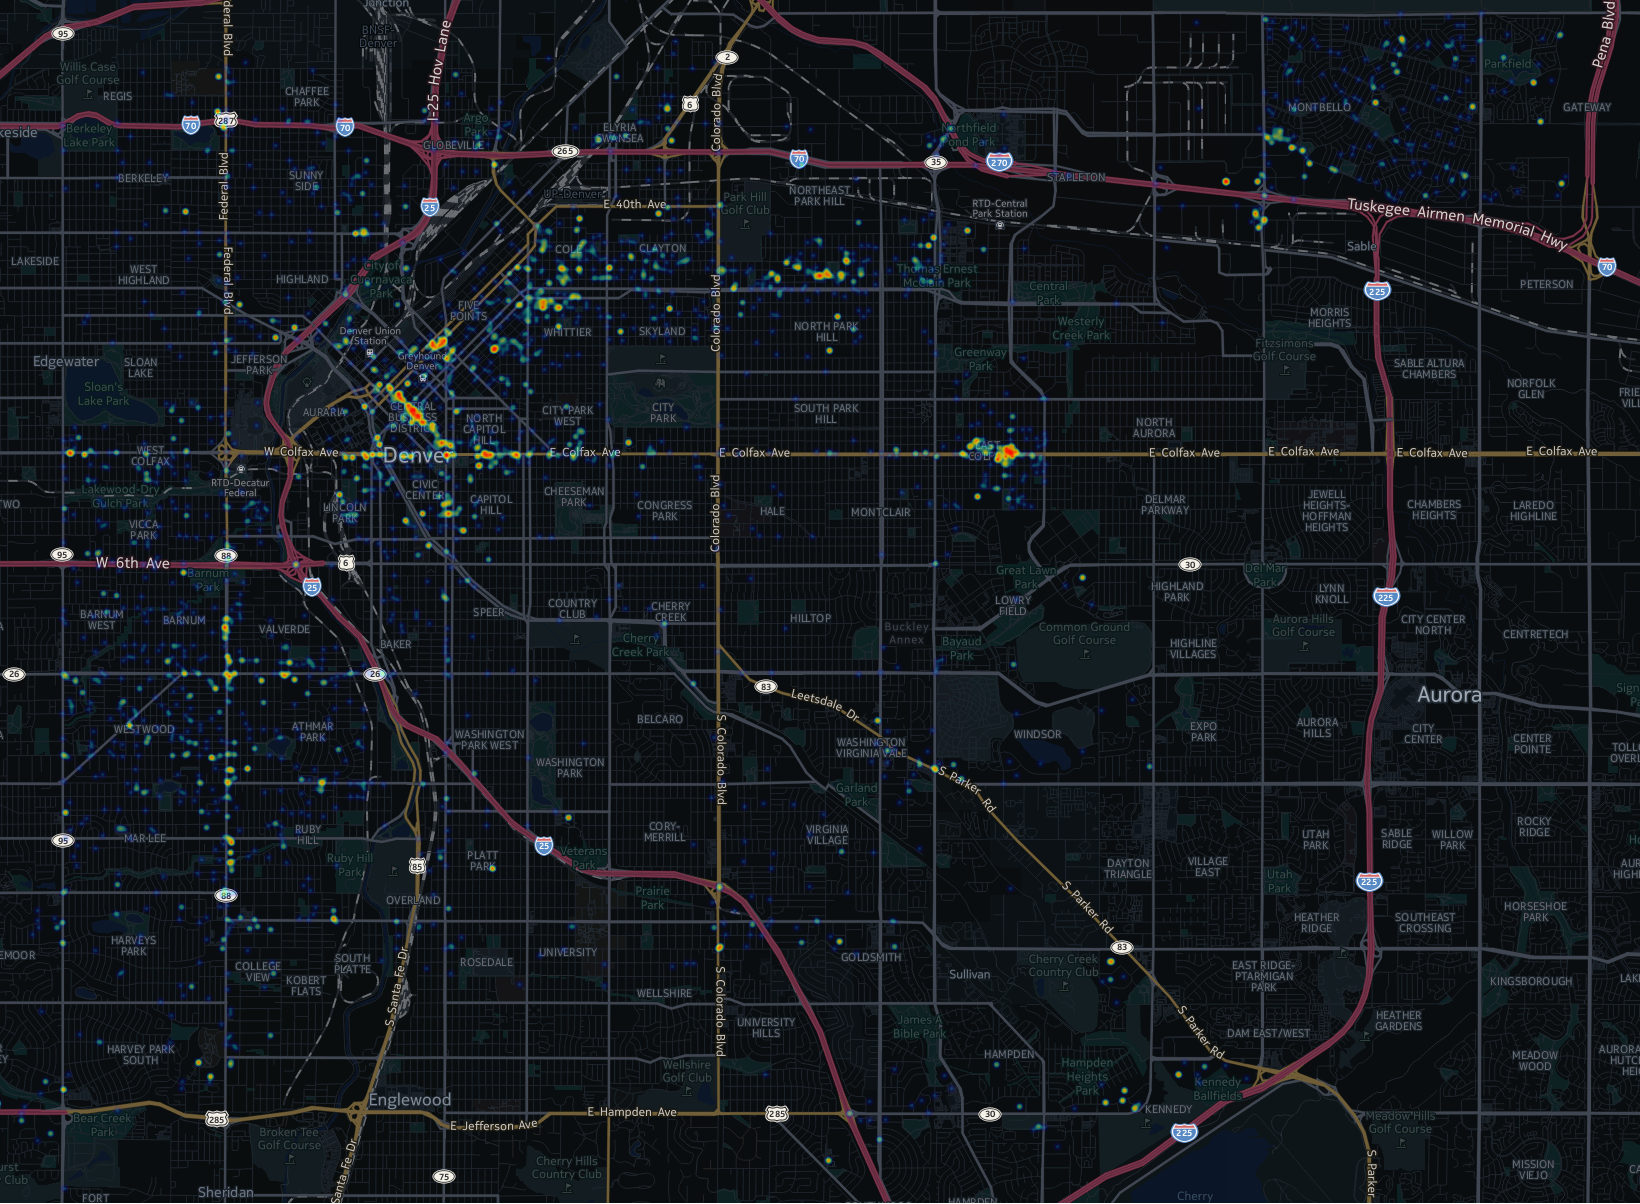
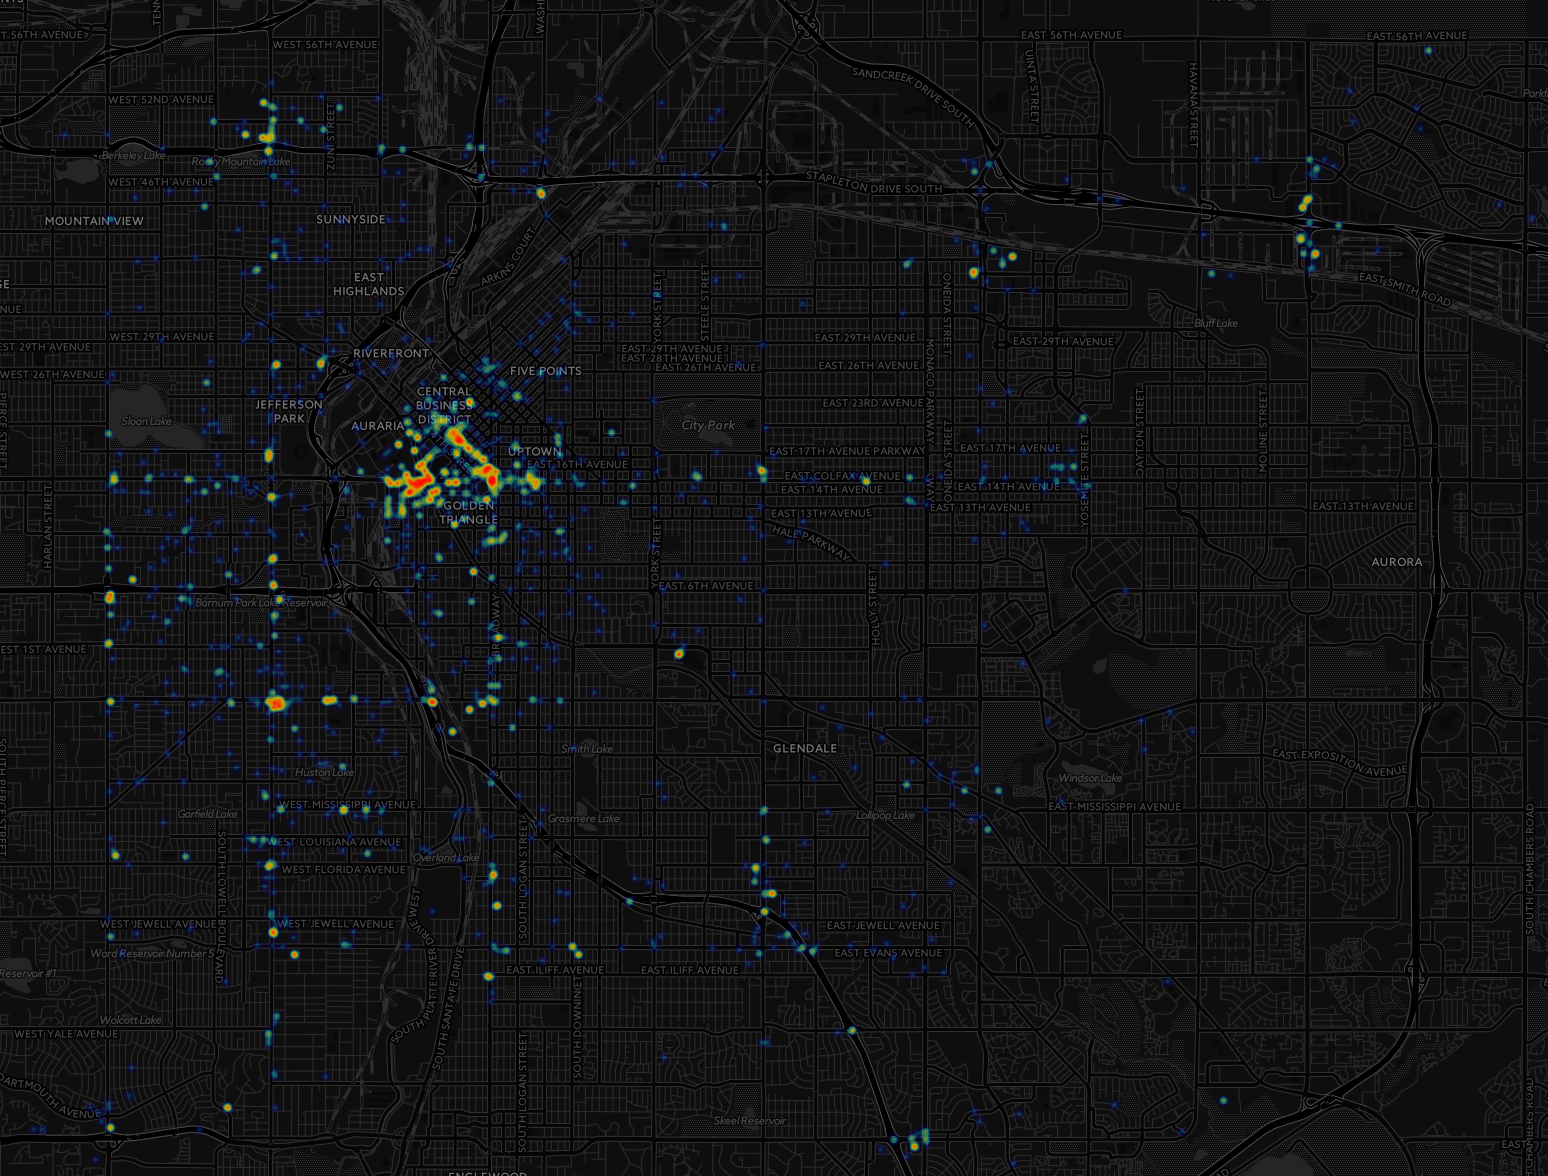
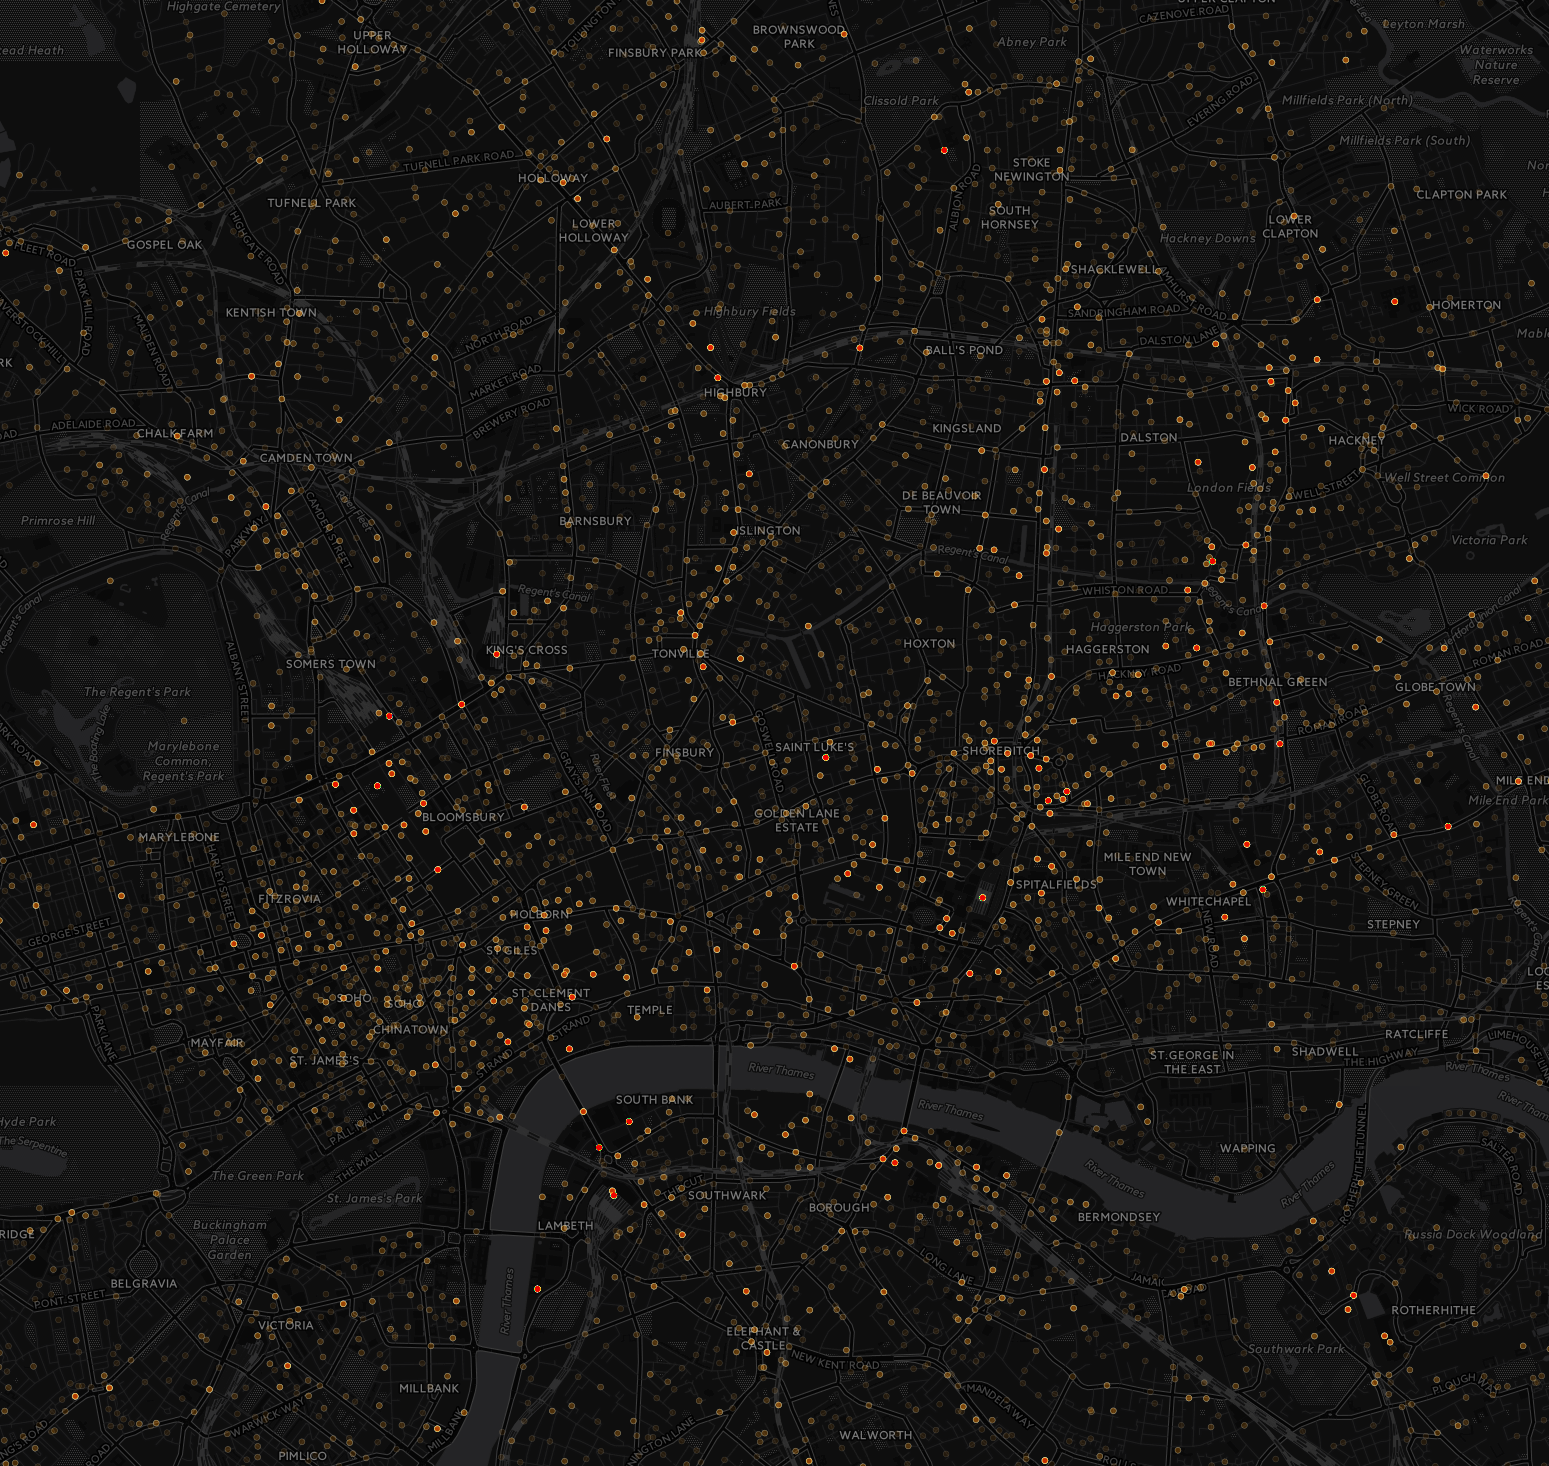
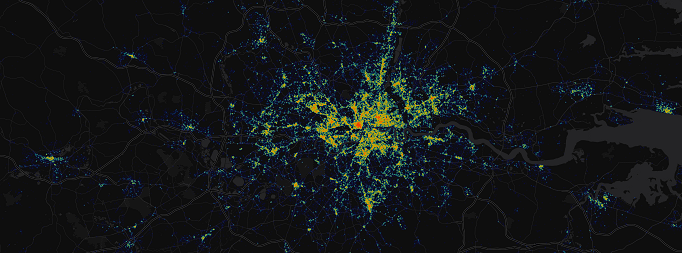
Heat Map
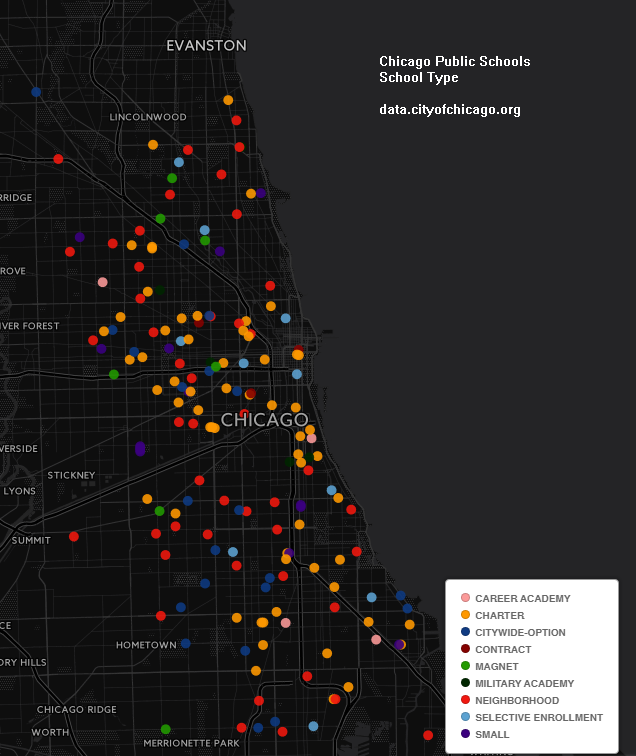
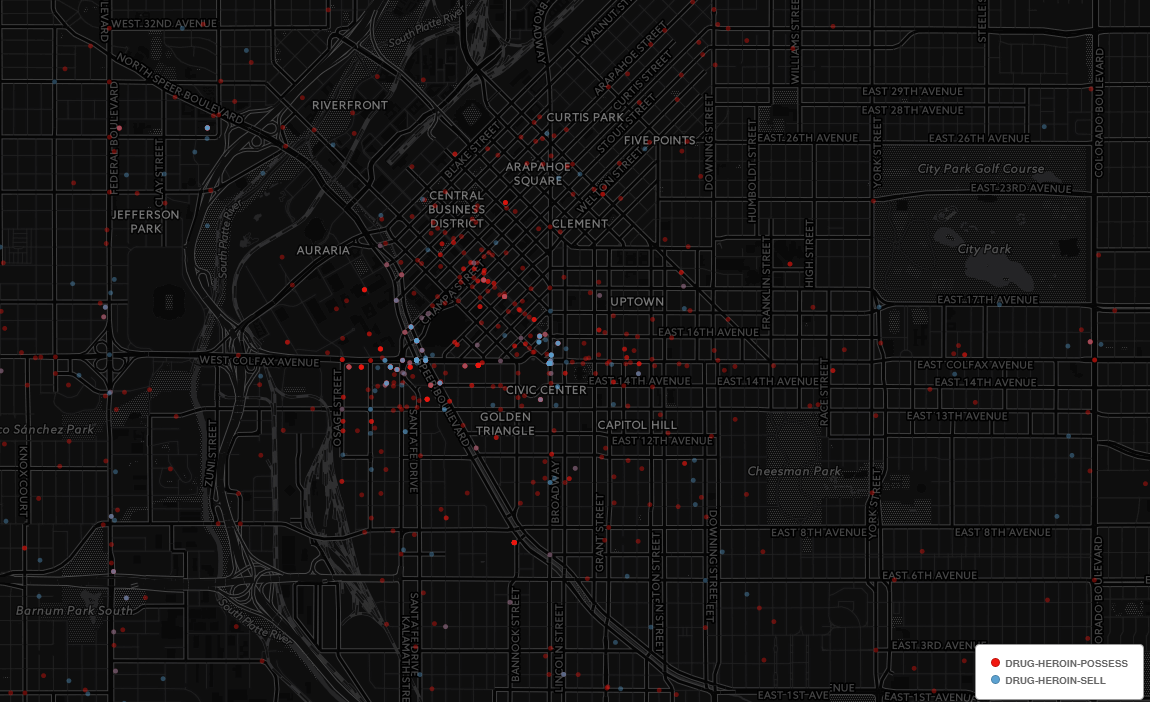
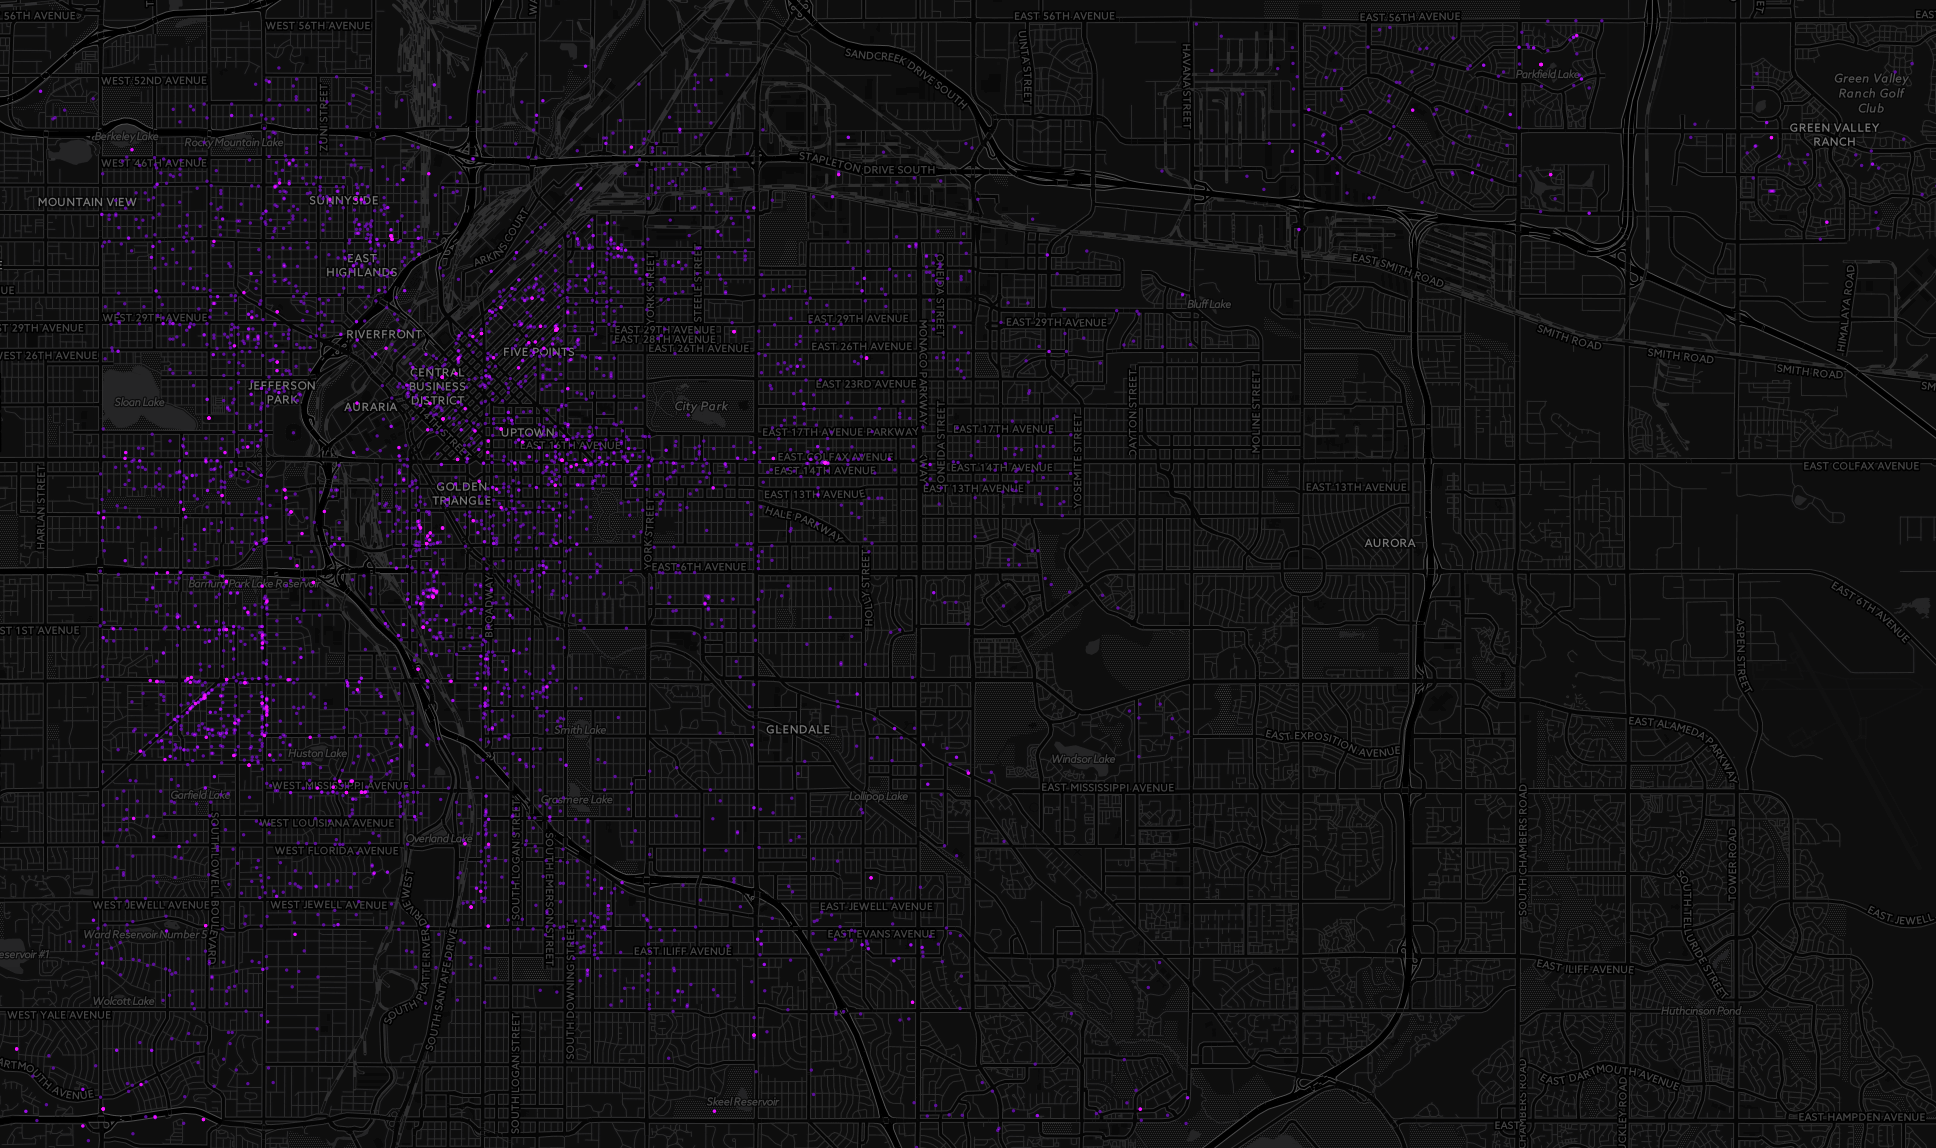
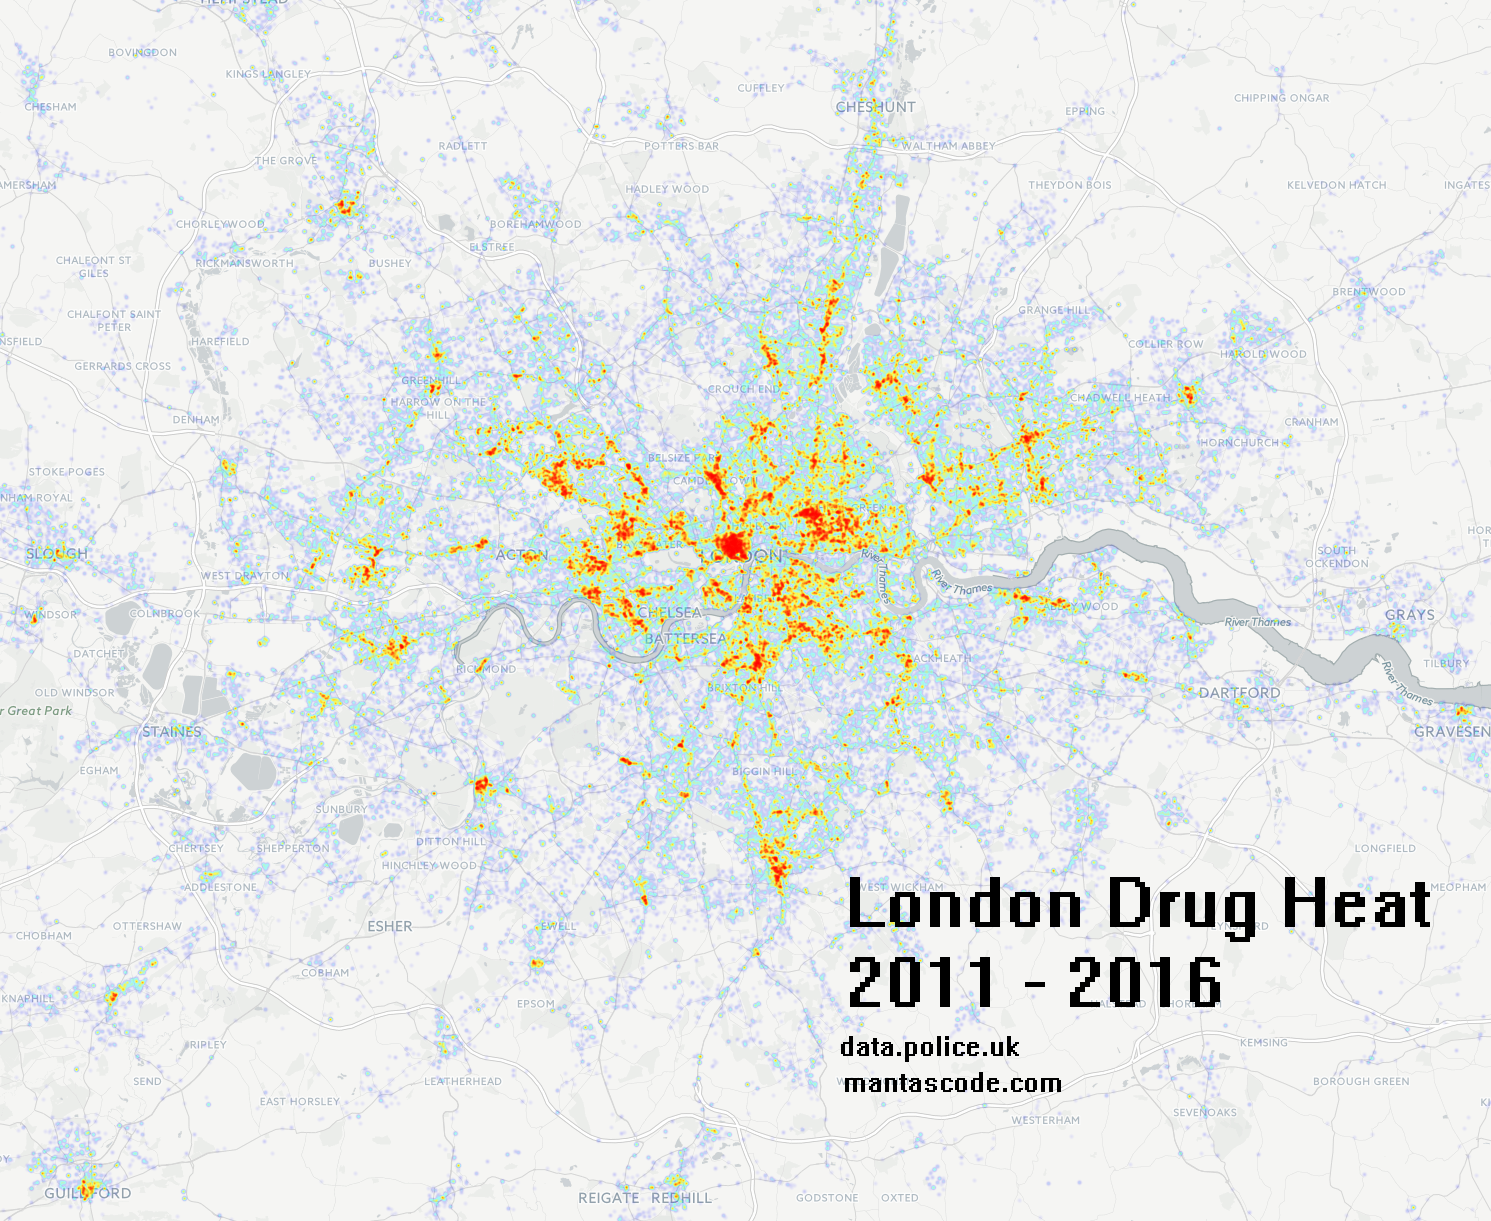
Type Map (Click to enlarge)