Category Archives: Chicago Data

Chicago, Cook County – Defense Department’s 1033 program charts.

The data was found on github here:
Military Surplus Gear

The charts below cover Chicago, IL, Cook County
gunart

 This chart displays Rifles and Pistols received by year.
riflespistols1033cookcounty

This graph shows most popular equipment items received from 2006 through May 2014.
AllEquipment


Ruby code used to parse and format the data.  Google charts was used to display it.
Ruby to Parse all equipment in cook county


Chicago Gov-Job Average Salary Bubble Charts.

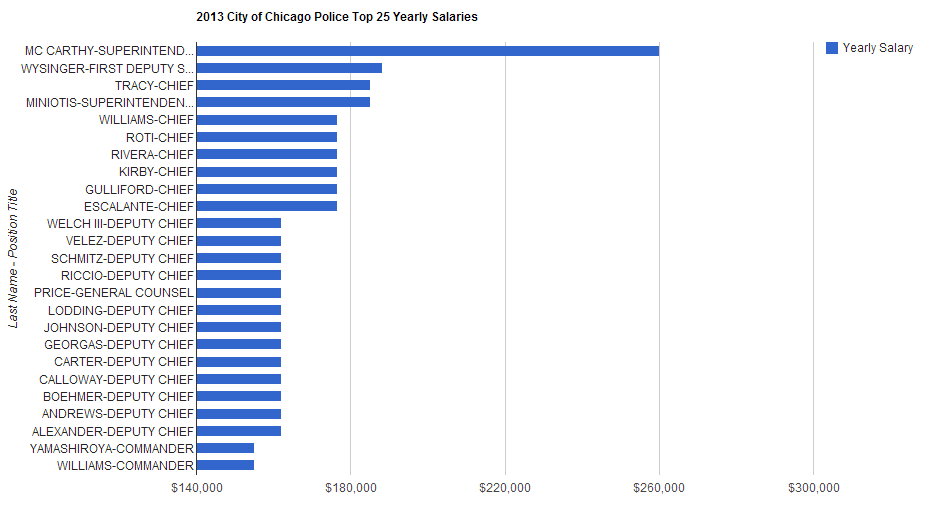
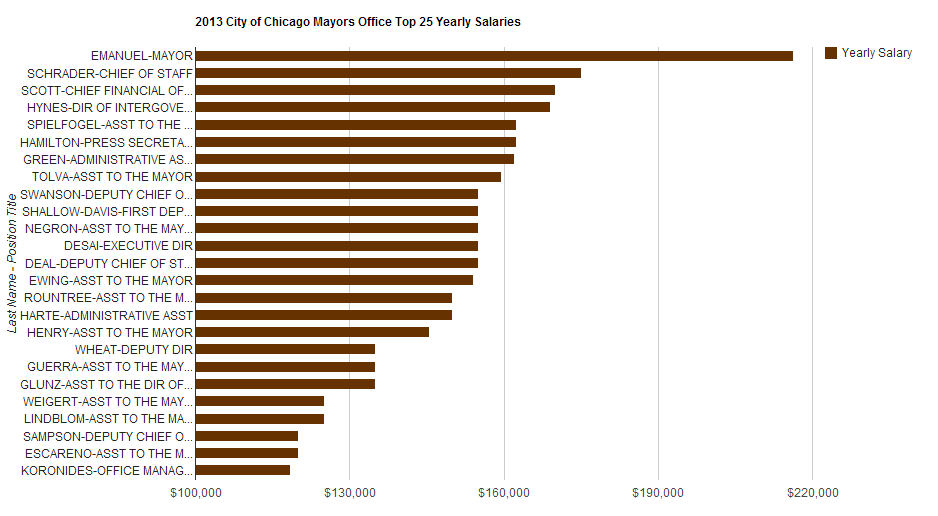
According to this data : Current Employee Names, Salaries, and Position Titles on City Of Chicago Data Portal https://data.cityofchicago.org/;

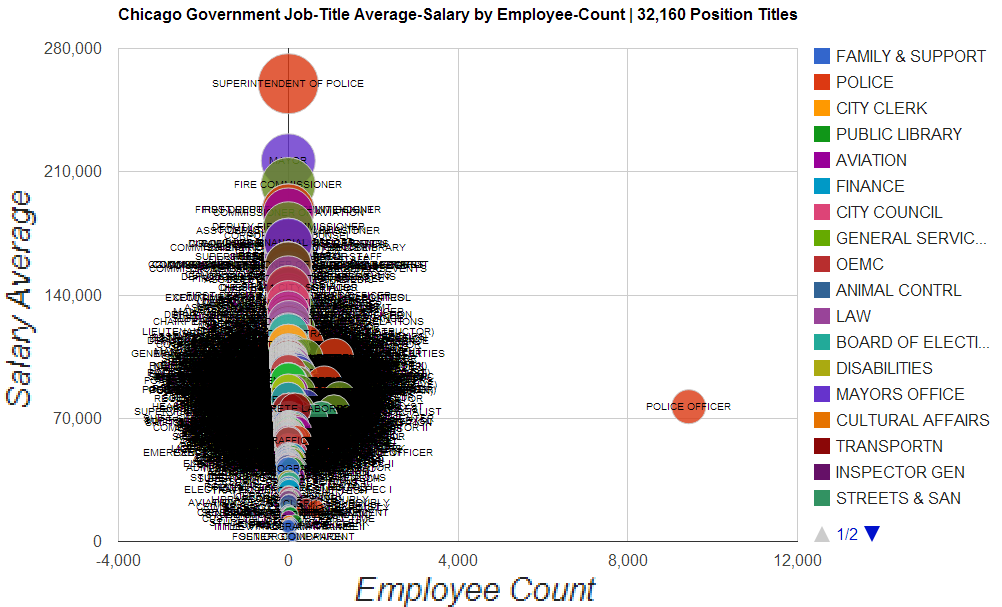
The Chicago government employees 32,160 employees, and pays approximately $2,429,980,941.36 in annual salaries.

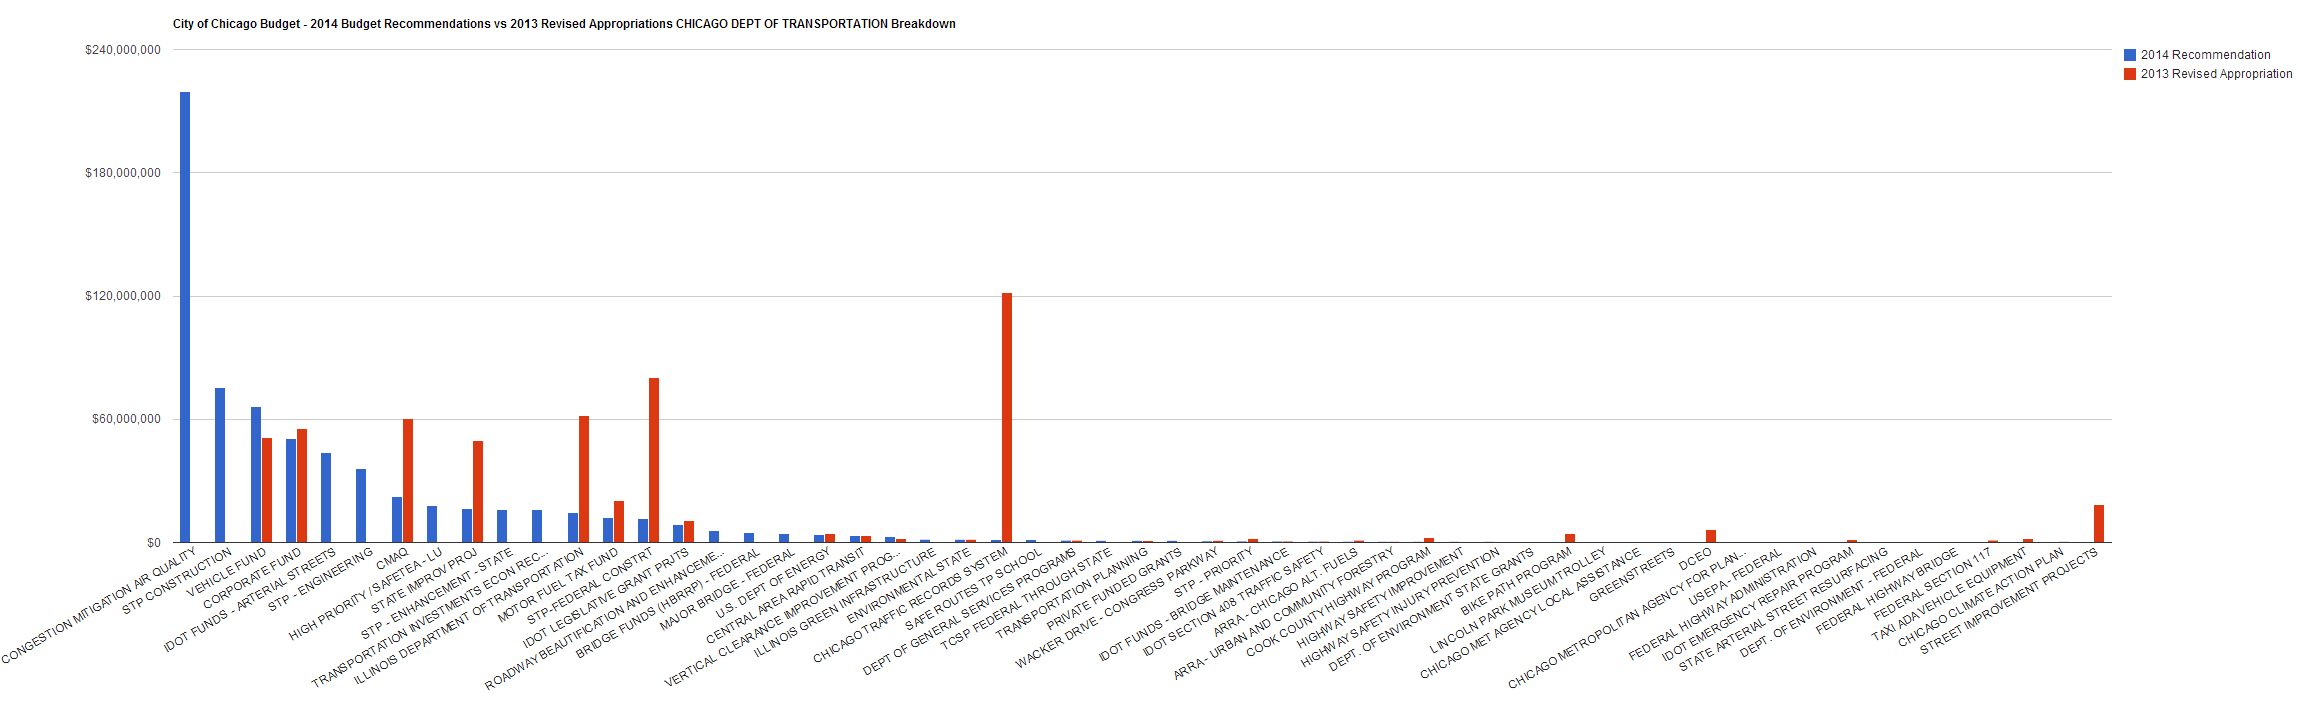
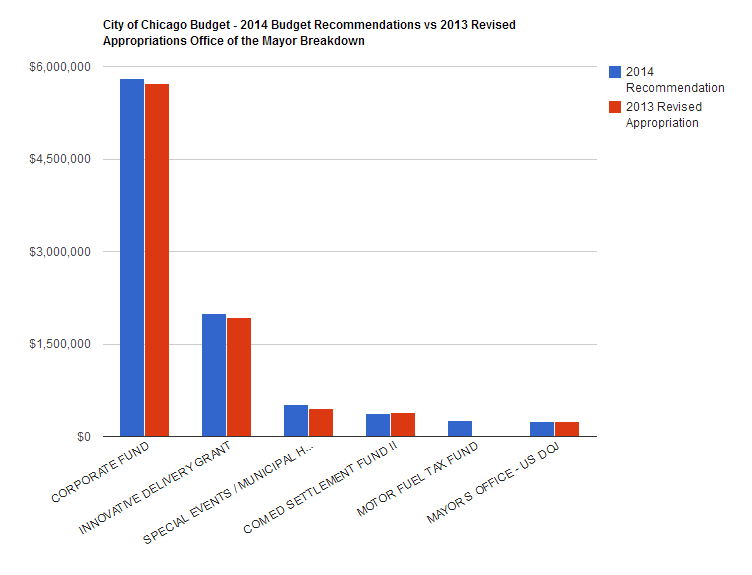
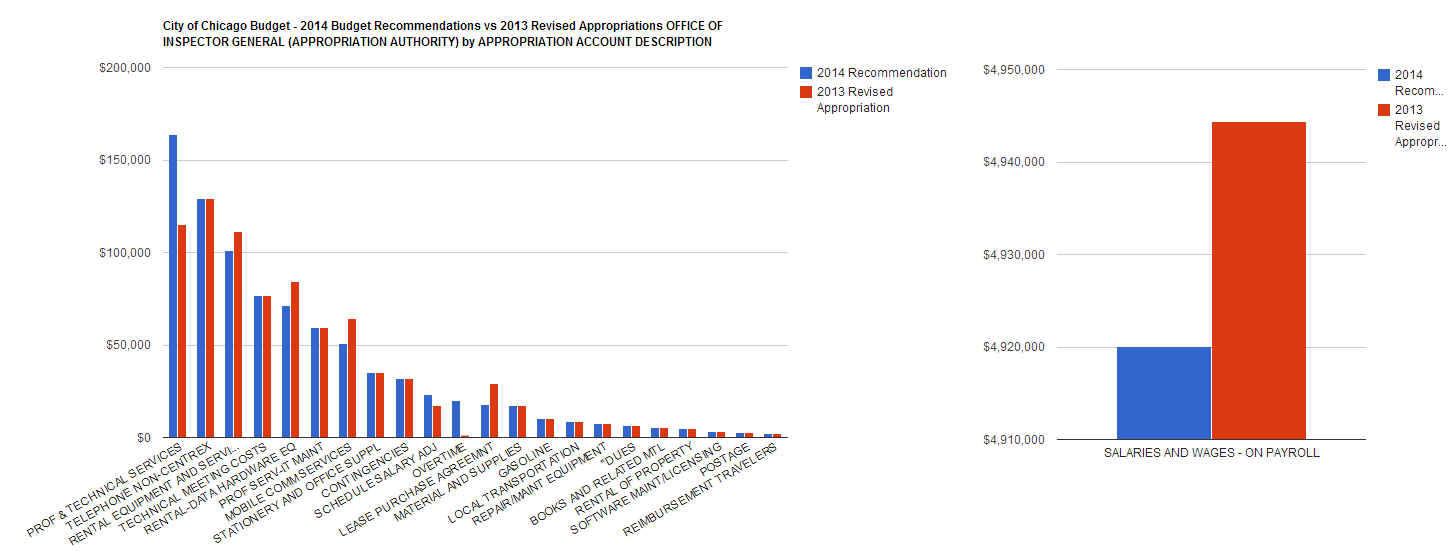
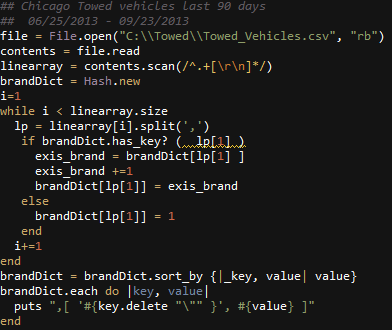
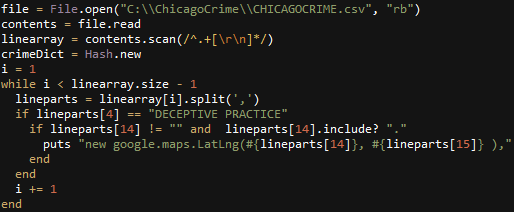
Google Charts API was used.

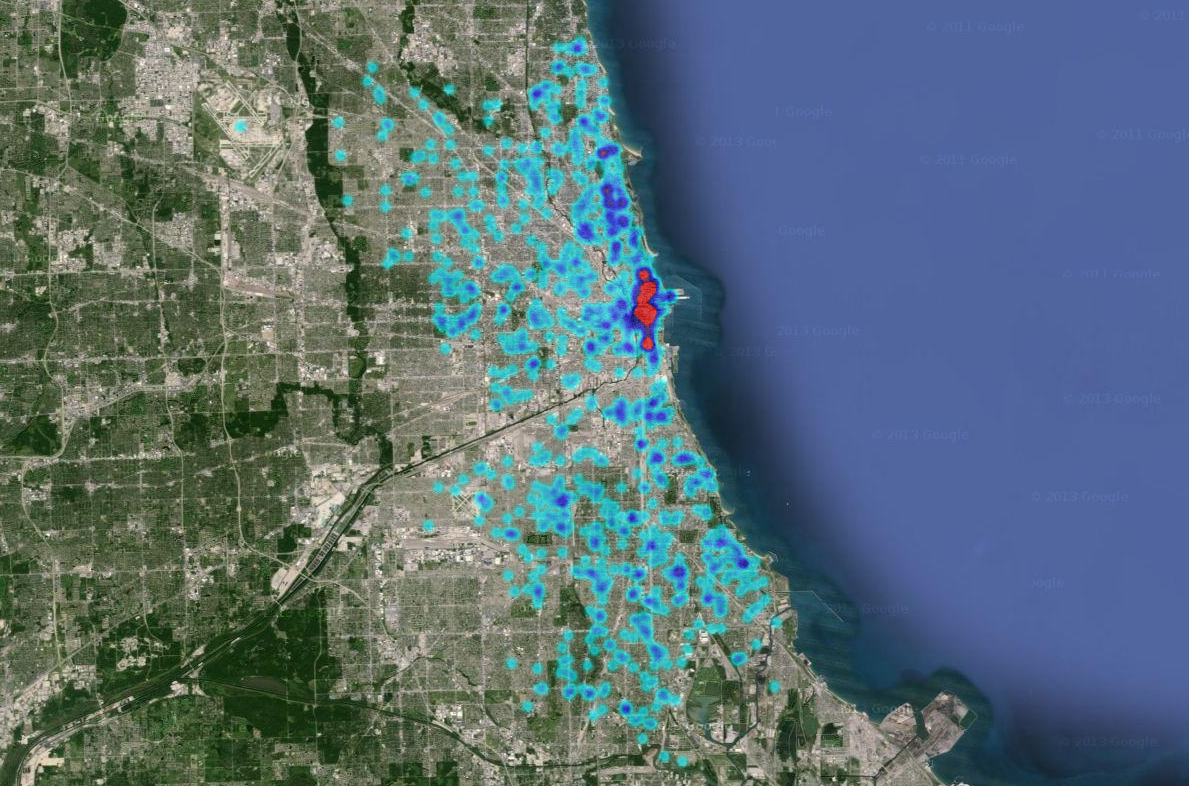
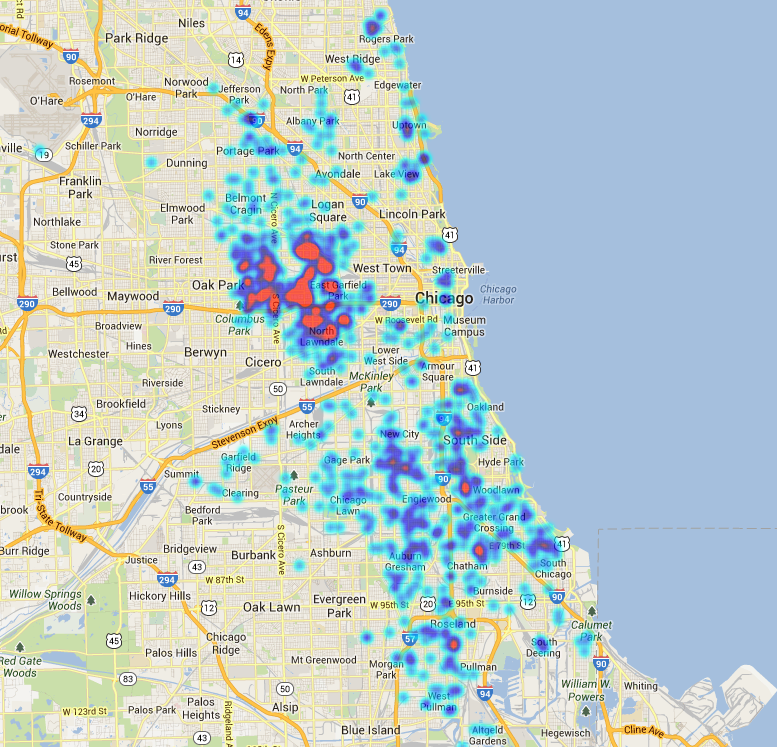
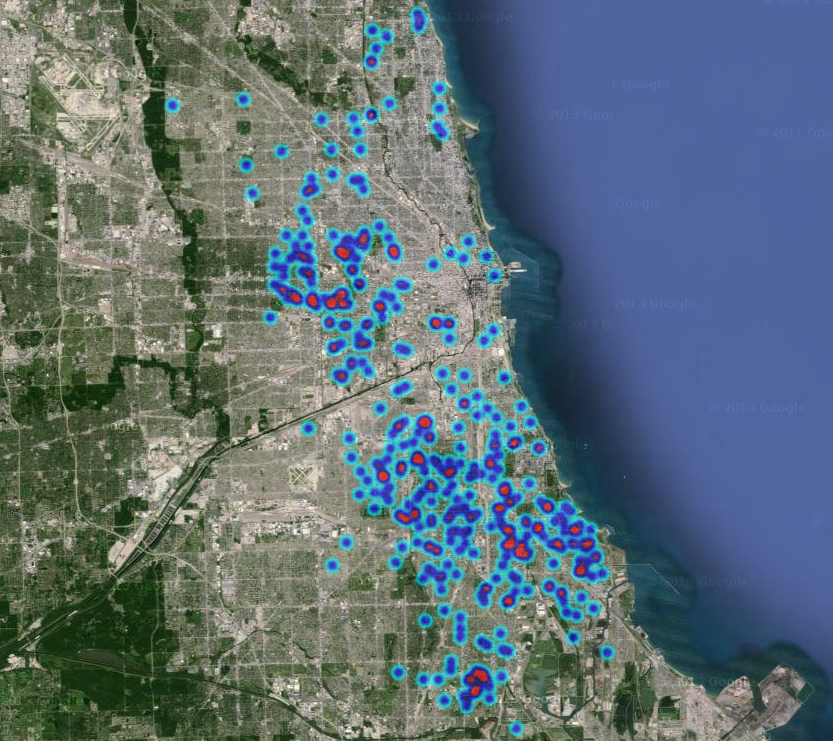
CLICK ON Pictures FOR Focus. (temporary courtesy of imgur)

All Employees.

image1

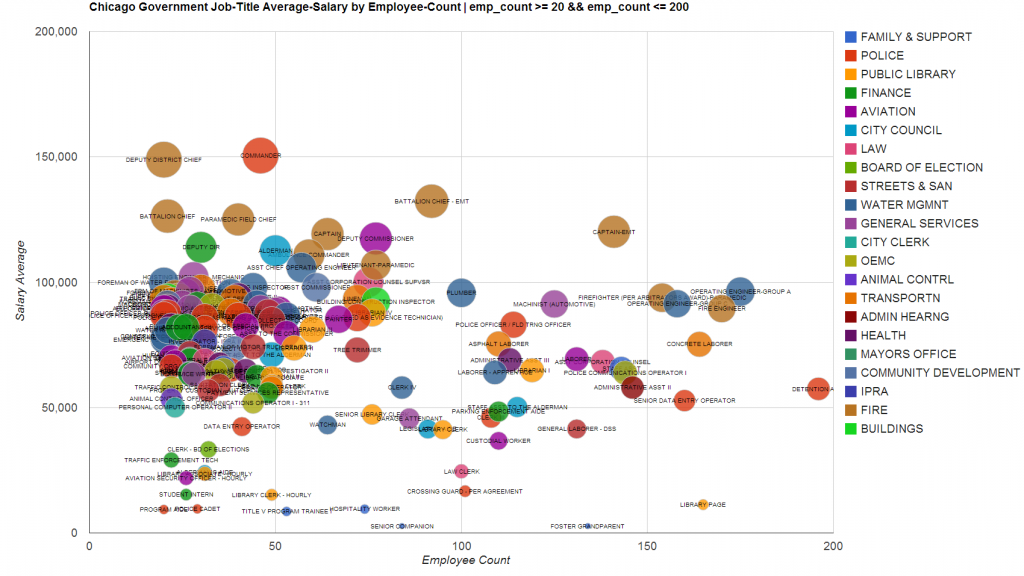
Let’s remove distinct Position-Titles with Less Then 10 Employees, and the position title of Police Officer from the data.

image2

(20 or more), and, (200 or less); employee counts within a position title.

image3

(10 or more), and,( 50 or less); employee counts within a position title.

FINALBIGCHART

C#

int counter = 0;
string line;
Dictionary<string, int> dCount = new Dictionary<string, int>();
Dictionary<string, decimal> dSalTotal = new Dictionary<string, decimal>();
Dictionary<string, LinkedList> dDeps = new Dictionary<string, LinkedList>();
System.IO.StreamReader file =
    new System.IO.StreamReader("C:\\AAAChicagoEmployees\\Current_Employee_Names__Salaries__and_Position_Titles (1).csv");
while ((line = file.ReadLine()) != null)
{
    string[] parts = line.Split(',');
    try
    {
        string name = parts[2];
        name = Regex.Replace(name, "'", "");
        string dep = parts[3];
        decimal sal = decimal.Parse(parts[4].TrimStart('$')   );
        if ( dCount.ContainsKey(name  ) )
        {
            int a = dCount[name];
            a += 1;
            dCount[name] = a;
            decimal b = dSalTotal[name];
            b += sal;
            dSalTotal[name] = b;
            LinkedList c = dDeps[name];
            c.AddLast(dep);
            dDeps[name] = c;
        }
        else
        {
            dCount.Add(name, 1);
            dSalTotal.Add(name, sal);
            LinkedList newDepList = new LinkedList();
            newDepList.AddLast(dep);
            dDeps.Add(name, newDepList);
        }
    }
    catch (Exception x)
    {
        //header line
    }
    counter++;
}
file.Close();
Dictionary<string, decimal> dAveOrder = new Dictionary<string, decimal>();
foreach (KeyValuePair<string, int> item in dCount.OrderBy(key => key.Value))
{
    if (item.Value >= 10 && item.Value <= 50)
    {
        decimal aveSal = dSalTotal[item.Key] / item.Value;
        dAveOrder.Add(item.Key, aveSal);
    }
}
string json = "";
foreach (KeyValuePair<string, decimal> item in dAveOrder.OrderBy(key => key.Value))
{
    Hashtable frequencyHash = new Hashtable();
    LinkedList uniqueList = new LinkedList();
    foreach (var element in dDeps[item.Key])
    {
        if (uniqueList.Contains(element))
        {
            int elementCount = int.Parse(frequencyHash[element].ToString());
            elementCount++;
            frequencyHash[element] = elementCount;
        }
        else
        {
            uniqueList.AddLast(element);
            frequencyHash.Add(element, 1);
        }
    }
    int max = 0;
    string sMaxDep = "";
    foreach (string element in frequencyHash.Keys)
    {
        int iDep = int.Parse(frequencyHash[element].ToString());
        if (iDep > max)
        {
            max = iDep;
            sMaxDep = element;
        }
    }
    if (item.Key == "POLICE OFFICER")
    { }
    else
    {
        json += "[ '" + item.Key + "', " + dCount[item.Key] + "  , " + item.Value + " ,'" + Regex.Replace(sMaxDep, "'", "") + "' , " + item.Value + " ],\r\n";
    }
}
System.IO.StreamWriter fileWrite = new System.IO.StreamWriter("c:\\AAAChicagoEmployees\\data.txt");
fileWrite.WriteLine(json);
fileWrite.Close();

Chicago West Side Narcotics Arrest Heat Maps 1/1/2013 – 5/8/2014

A look into the West Side of Chicago’s Narcotics related Arrests.

westSide Chicago

The data is from City of Chicago Data Portal. Time Range used from 1-1-13 through 5-8-14. Data was exported and saved as CSV. Ruby code was written to parse out and format the coordinates. Google Heatmaps Javascript API v3 was used to generate the heatmaps.

Heroin
POSS: HEROIN(WHITE), MANU/DELIVER: HEROIN (WHITE), POSS: HEROIN(BRN/TAN), POSS: HEROIN(BLACK TAR), MANU/DELIVER: HEROIN(BRN/TAN), MANU/DELIVER:HEROIN(BLACK TAR)
heroin_crop

Cocaine
POSS: COCAINE, MANU/DELIVER:COCAINE
cocaine_crop

Crack
MANU/DELIVER:CRACK, POSS: CRACK
crack_crop

PCP
POSS: PCP, MANU/DELIVER:PCP
pcp_crop

Marijuana
POSSESSION: SYNTHETIC MARIJUANA, MANU/POSS. W/INTENT TO DELIVER: SYNTHETIC MARIJUANA, POSS: CANNABIS 30GMS OR LESS, MANU/DEL:CANNABIS OVER 10 GMS, POSS: CANNABIS MORE THAN 30GMS, MANU/DEL:CANNABIS 10GM OR LESS, DELIVER CANNABIS TO PERSON <18, CANNABIS PLANT, ATTEMPT POSSESSION CANNABIS
marijuana_crop

Hallucinogen
POSS: HALLUCINOGENS, MANU/DELIVER: HALLUCINOGEN
hallucinagen_crop

DataViz: Visualizing Chicago Narcotics Crime Data.

In this post, I will give a semi-detailed overview of how to make an animated heat map over a time range.  This is my first attempt at making an animated heat map.

I will be revisiting Chicago crime statistics from City of Chicago Data Portal 2001-2013

This dataset reflects reported incidents of crime (with the exception of murders where data exists for each victim) that occurred in the City of Chicago from 2001 to present, minus the most recent seven days.Data is extracted from the Chicago Police Department’s CLEAR (Citizen Law Enforcement Analysis and Reporting) system. Read More about the dataset here

On 11/28/2013 I downloaded a csv from chicago’s data portal named Crimes_-_2001_to_present.csv, its size was 1,050,688 KB

Here is an example of how I would parse out all coordinates of narcotics violations for the month of January in 2013.
rubyspecific

Lets test the coordinate outputs by appending them into a google maps heatmap.
SingleMonthTest

Okay, now I’m going to manually make one of these images (with static center and size) for each month from January 2012 to October 2013. Next, I wrote a quick c# application using ImageMagick to programmatically crop each Browser screenshot.

string[] files = Directory.GetFiles(@"c:\__FULLCHICAGOCRIME\Months\ScreenShots");
foreach (string file in files)
{
    string ext = Path.GetExtension(file);
    if (ext == ".png")
    {
        string filenameNoExt = Path.GetFileNameWithoutExtension(file);
        string filenameExt = Path.GetFileName(file);
        Directory.CreateDirectory(@"c:\ImageConversion\" + filenameNoExt);
        Process imProcess = new Process();
        string im_command =  file + @" -crop 800x800+500+300 c:\__FULLCHICAGOCRIME\Months\ScreenShots\cropped\" + filenameNoExt + "_cropped.png";
        imProcess.StartInfo.UseShellExecute = false;
        imProcess.StartInfo.RedirectStandardOutput = true;
        imProcess.StartInfo.FileName = @"c:\__FULLCHICAGOCRIME\Months\ScreenShots\convert";
        imProcess.StartInfo.Arguments = im_command;
        imProcess.Start();
        imProcess.WaitForExit();
    }
}

Now I have the frames for my animation.
croppedimages

Lastly, I append all these images into a movie using Windows Movie Maker, and add some Beethoven as background music.

Ruby: Visualizing 2014 Chicago Budget Recommendations

Once again, the data is from City of Chicago Data portal

chicago

The dataset details 2014 Budget Recommendations, which is the line-item budget document proposed by the Mayor to the City Council for approval. Budgeted expenditures are identified by department, appropriation account, and funding type: Local, Community Development Block Grant Program (CDBG), and other Grants. “Local” funds refer to those line items that are balanced with locally-generated revenue sources, including but not limited to the Corporate Fund, Water Fund, Midway and O’Hare Airport funds, Vehicle Tax Fund, Library Fund and General Obligation Bond funds. Owner: Budget and Management. Frequency: Data is updated annually. For more information about the budget process, visit the Budget Documents page:

Here is a breakdown of the 2014 recommendations compared with revised 2013 appropriations by department.

Over 10 million dollars and excluding Finance General
2014Chicago_Budg_Dep_rec_vs_2013_approp

Here’s Financial General
FINANCE GENERAL 2013 appro_2014 Rec

Breakdown of Financial General
GenFinvs

Police Breakdown excluding Corporate Fund
Police breakdown

Police Corporate Fund
Police corporatefund20132014

Department of Transportation
DeptTransportBreakdown

Office of the Mayor
Office of mayor


City of Chicago Budget – 2014 Budget Recommendations vs 2013 Revised Appropriations OFFICE OF INSPECTOR GENERAL (APPROPRIATION AUTHORITY) by APPROPRIATION ACCOUNT DESCRIPTION

Office of Inspector General Both


Ruby example used to parse the data
RubyFor2013vs2014

Ruby: Visualizing 2013 City of Chicago Top 25 Yearly Salaries.

The data is from https://data.cityofchicago.org/

This dataset is a listing of all current City of Chicago employees, complete with full names, departments, positions, and annual salaries. For hourly employees the annual salary is estimated. Data Owner: Human Resources. Frequency: Data is updated quarterly.

POLICE
mc_Police

FIRE
mc_fire

HEALTH
mc_Health

AVIATION
mc_Aviation

MAYOR’S OFFICE
mc_mayor

How the Data was parsed and formatted.
parsingthechicagodata

Ruby: Graphing Chicago Towed Vehicles by Brand and Color

cartowedformat

Data is from City of Chicago Data Portal

This dataset displays location for vehicles that have been towed and impounded by the City of Chicago within the last 90 days. Illegally parked vehicles, abandoned vehicles and vehicles used for illegal activities may be towed by the Chicago Police Department, the Department of Streets and Sanitation, the Department of Revenue, Aviation and the office of the City Clerk.

TIME RANGE 06/25/2013 – 09/23/2013 (90 Days)

VEHICLE COLOR
ChicagoTowedByColor

VEHICLE BRAND
ChicagoTowed by brand

Ruby Code used to parse and manicure data.
rubycarparse

Ruby: Using Google Maps Heat Map to Display Chicago Crime Statistics

Each crime report contains latitude and longitude coordinates.  I used ruby to parse out each coordinate from this source :  https://data.cityofchicago.org.  Then I appended those points into a heat map.

Update: This dataset has been expanded on, in this post DataViz: Visualizing Chicago Narcotics Crime Data.

Chicago DECEPTIVE PRACTICE – 8/8/2012 to 8/8/2013

DECEPTIVE PRACTICE

Chicago ALL CRIMES – 8/8/2012 to 8/8/2013
HEATMAPOFCRIME

Chicago NARCOTICS – 8/8/2012 to 8/8/2013
NARCOTICS

Chicago HOMICIDE – 8/8/2012 to 8/8/2013
murderonlysat

Ruby example to parse all coordinates for Primary Crime Type: DECEPTIVE PRACTICE
RUBY

Output
output

Ruby: Using Google Charts to Graph Chicago Crime Data

Recently I decided to visualize some of Chicago’s Crime Data.  I used ruby to parse and manicure it into JSON, and Google Charts to display it.

The Data is from : https://data.cityofchicago.org/

Google Charts API : https://developers.google.com/chart/

The data was saved in CSV format on my local C: Drive
Local Path : C:\ChicagoCrime\CHICAGOCRIME.csv
Data chosen ranges from 8/8/2012 to 8/8/2013

Ruby Code used to create the JSON
Ruby Chicago Crime

JSON Output
JSONOUTPUT

Column Chart Created
chicago crimes