Category Archives: Chicago Data

Visualizing Chicago’s affordable rental housing developments (Multifamily)

Multifamily public housing development visualizations by unit count/neighborhood for multifamily property types, and a word cloud of the most popular management companies. The data is from data.cityofchicago.org

chicagopublichousing

The affordable rental housing developments listed below are supported by the City of Chicago to maintain affordability standards.

ChicagoMultifamily Affordable Rental Housing Developments Common Community Areas ColorChicagoMultiFamilyUnitCountCountBubble

ChicagoMultiFamilyUnitCountCountColorAffordable Rental Housing Developments management Company WordCloud

Comcast’s Monetary Influence Over Illinois Political Candidates

I found an interesting dataset on political contributions in the state of Illinois.. The downloadable .zip contains multiple tab delimited database files which contain the relationships between Donations, Committees, and Candidates.

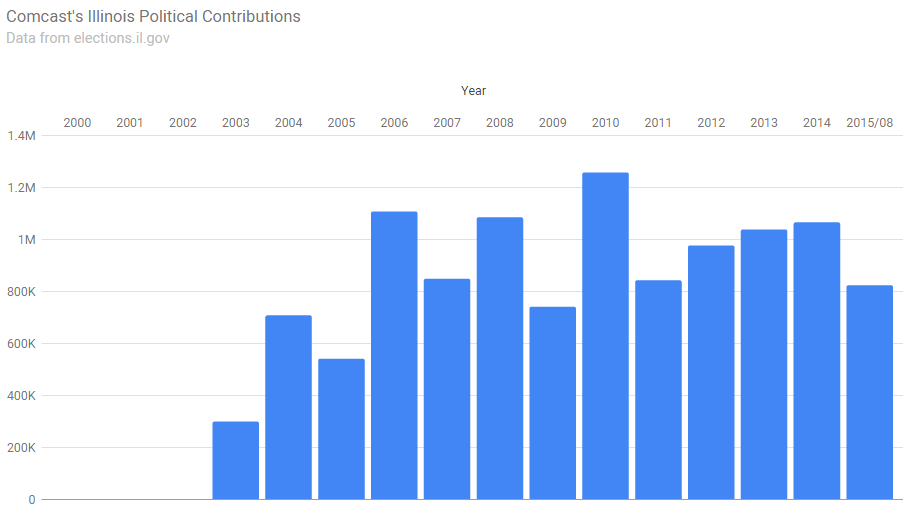
Out of curiosity in seeing Comcast’s political influence in Illinois over time, I parsed the 650,775mb file called Receipts.txt. Below is a bar chart of yearly recorded donation totals from 2000 through 2015-08.

Comcast_DPolitical_Donations_2000-2015-6_2

Not being very politically oriented, I wanted to somehow relate the donations to candidates. But in the form of the available data, it appears Donors make contributions to Committees, and Committees support a Candidate. But I do not know if Candidates and Committees are a One to One relationship at the time of typing this.

Parsing the text file called CmteCandidateLinks.txt, I related the Committee Id with the candidate Id. Parsing the text file called Candidates.txt I relate the Candidate Id to the Candidate name.

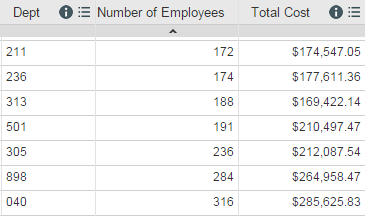
Lots of candidate duplicates per donation entry. Majority of Committees represent the same candidate under different ids, while some committees represent multiple candidates. Example here:

donations-2-commit-2-candids

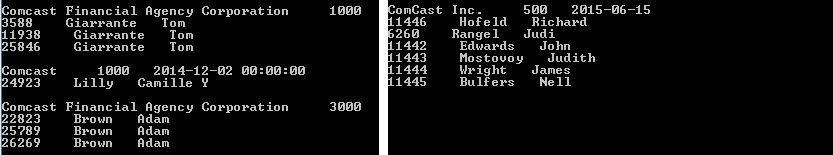
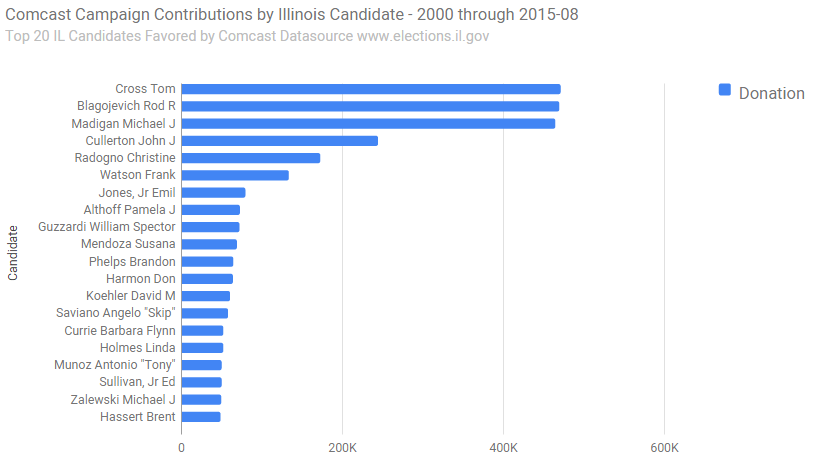
So I decided to distribute each donation amount between a potential multitude of candidates. I did this by dividing each donation by the number of candidates which belong to the committee recipient. From that, I got this list of Comcast’s Top Illinois Candidates.

top_20_illinois_Candidates_Recieve_Donation_from_Comcast

Continue reading

Cook County Employee Healthcare Costs by Department – June 2012

I came across an interesting data set while browsing datacatalog.cookcountyil.gov.  It can be found here.  Judging by the title, it appears to be healthcare costs for the month of June in the year of 2012.  There is no description, or any additional information I could find about it.  The data contains a department code, a number of employees, and a total cost.  It looks like this:

datascreenshot

I was curious, so I took the average cost of employee count (Cost / Emp num), per department.  I correlated the department numbers to labels from an alternative dataset also found on cook county’s data catalog.

My experiment resulted in two bubble charts.

Greater than 40 Employees

AverageEmployeeCostPerDepartment_GreaterThan40Employees


Greater than 40 Employees and less than 1,000

AverageEmployeeCostPerDepartment_GreaterThan40EmployeesLessThan1000

And now here’s the second chart processed with Google’s Deep Dream

2

Chicago Cannabis Decriminalization

A look into Chicago Police Department’s incident reports for marijuana related arrests.

ChicagoCannabisArrests_STill

The chart below displays over 15 years of CPD’s Cannabis related arrests for possession of 30 grams or less. The data is from data.cityofchicago.org

ChicagoCannaBisArrests_2001-2015_monthly_lessthan30gms

Here is the ruby code written to accumulate the monthly totals. Additional data filtering was done on the Socrata website prior to exporting the csv data file. Google Charts was used to create the line chart. CartoDB was used to create the still of the torque map.
rubytoparsechicagocannabis

Chicago’s Prostitution Maps

A look into 15 years worth of prostitution through the eyes of the Chicago Police Department. The data is from data.cityofchicago.org. Time range includes years 2001 through 2015. CartoDB was used to create a Density, and Torque Map.

Density map
ChicagoProstitution2001-2015

Geo-temporal map animation, 15 years in 10 seconds.

West Side Chicago Narcotics Enforcement Migrations

In this post I look into Chicago Police Department’s enforcement of two particular narcotics report types: Heroin and Crack Cocaine. I was curious to see yearly migrations of CPD’s activity from 2003 to 2014 in the west side region of Chicago.

heroin and crack molecule

The Data is from City of Chicago Data Portal

Links to youtube video animated heatmaps (some mobile devices don’t support embedded videos on my site):
http://www.youtube.com/watch?v=2qGPhlBGWxQ
http://www.youtube.com/watch?v=uh22pGBLgYo
http://www.youtube.com/watch?v=czoofaWOAps

Monthly

Yearly


Ruby was used to parse the data and convert into JSON.
Google Heatmaps API was used to generate the maps.
Camtasia Studio 8 was used to annotate and export the videos.

Ruby written to create monthly maps

RubyToCreateMonthlyMaps