Fun with random data. Find, investigate, and plot.
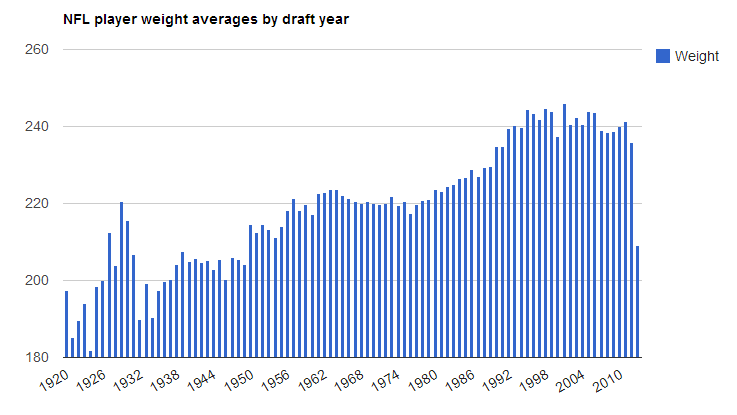
I parse an NFL dataset, and visualize it in a GoogleCharts Column Chart.
The video above details the steps taken
- Download NFL CSV data from reddit post
- Open downloaded file with OpenOffice and notepad to check it out
- Create an Aptana Ruby Project
- Copy CSV data into a specific directory
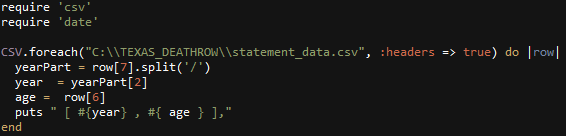
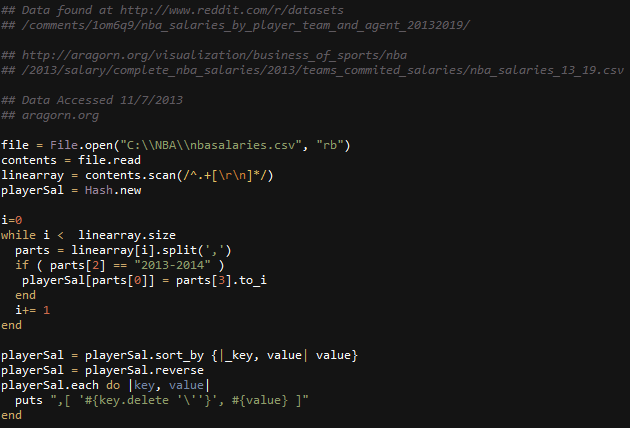
- Write Ruby code to: Read Each line of the csv file, Test by outputting each player name (3rd column)
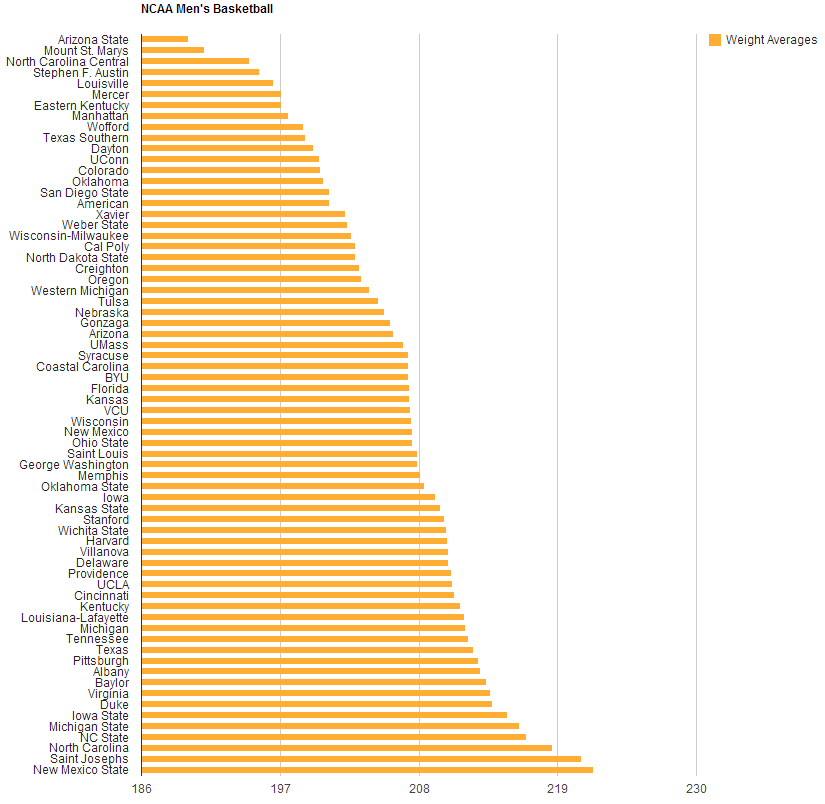
- Figure out what to chart
- Find specific columns within the dataset (Weight, draft_year)
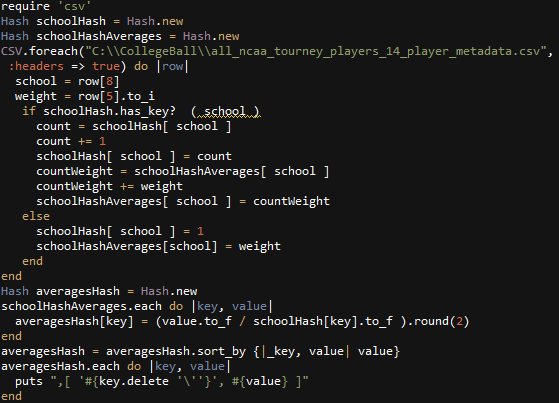
Ruby:
- Adjust ruby code to get columns, confirm for integrity
- Create variables for weight and draft year
- Create Hash’s for Counts and Averages
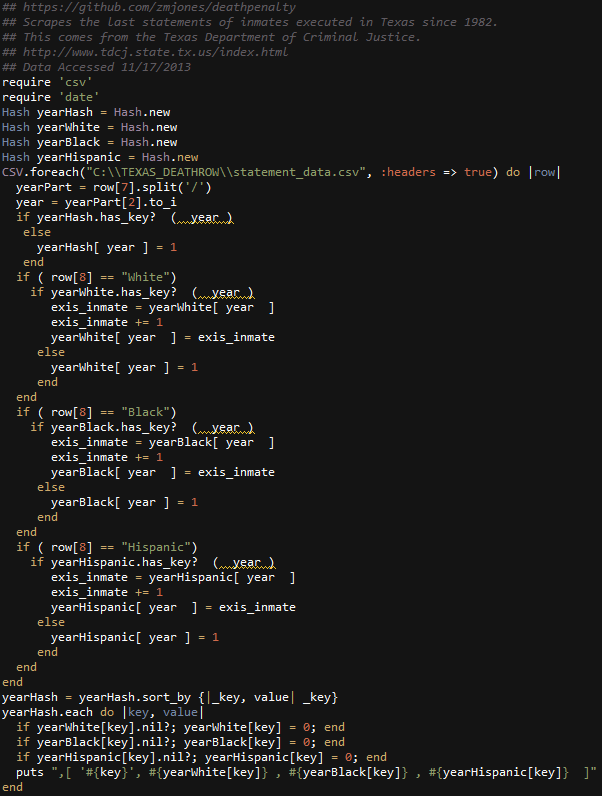
- Populate the year hash count variable as you iterate through each row:
- – If the year hash count variable doesn’t have a year, create a new hash entry, specifying the year as the key, and setting the initial value to 1
- – If the year hash count variable already contains a key with the next row’s year, then get its value, increment it by 1, and update the pair.
- Do the same thing for the weight averages hash, only with weight. Accumulate weight totals for each year.
- cast weight and draft year variables into integers
- iterate through year count hash.
- Create new has with year and weight averages hash.
- Perform calculations on each pair in year hash count. Cast pairs into float types, divide weight accumulated totals, by counts.
- Sort new hash
- output the contents of new hash.
- fix mistakes.
Google Charts html formatting:
- Obtain a Column Chart from GoogleCharts and save it locally as an html.
- Adjust example properties with note pad.
Ruby:
- Adjust output into appropriate JSON
- Enjoy your chart.