Ever have your Drivers License scanned at a store? Well here’s the private information you’re releasing by State.
What is on the Drivers License Bar Code?

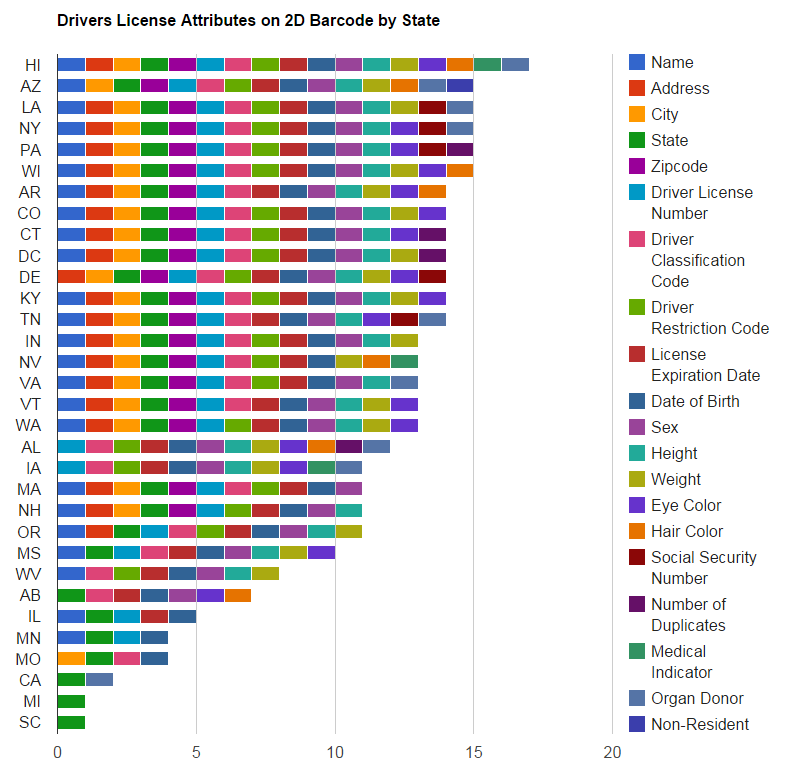
The data was accessed on 2/9/2015
from http://turbulence.org/Works/swipe/mainTable.html

Ever have your Drivers License scanned at a store? Well here’s the private information you’re releasing by State.
What is on the Drivers License Bar Code?
The data was accessed on 2/9/2015
from http://turbulence.org/Works/swipe/mainTable.html
2014 Oregon Health Authority Immunization Program
Data found here
Y Axis Adjusted Enrollment Count
X Axis Nonmedical Exemption Rate %
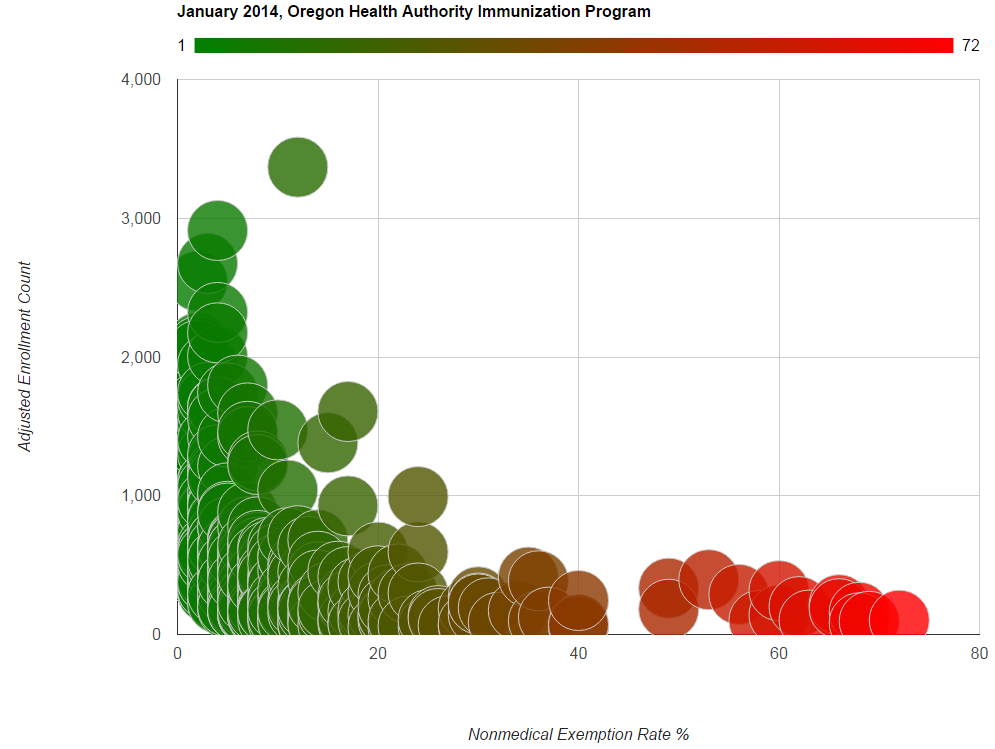
Now let’s add some School Names to the tail ends of the chart above.
(Click on images for higher resolution)
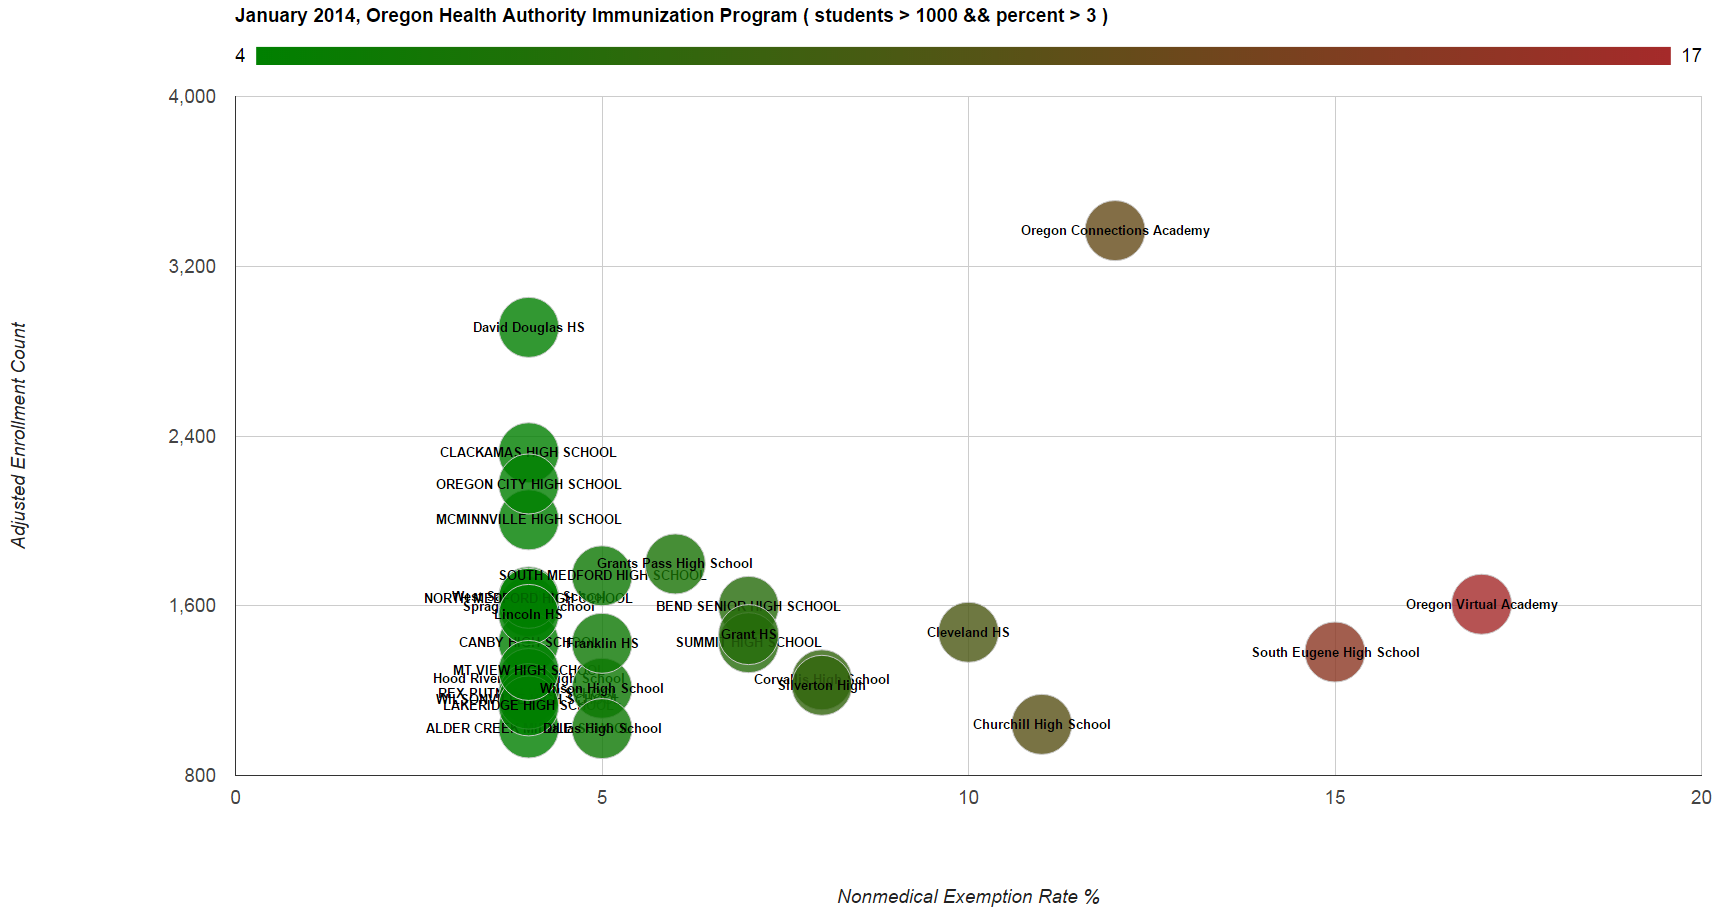
Over 1,000 Enrolled and Nonmedical Exemption Rate % Greater than 3
School Names with over 3% percent of unvaccinated and have over one thousand students..
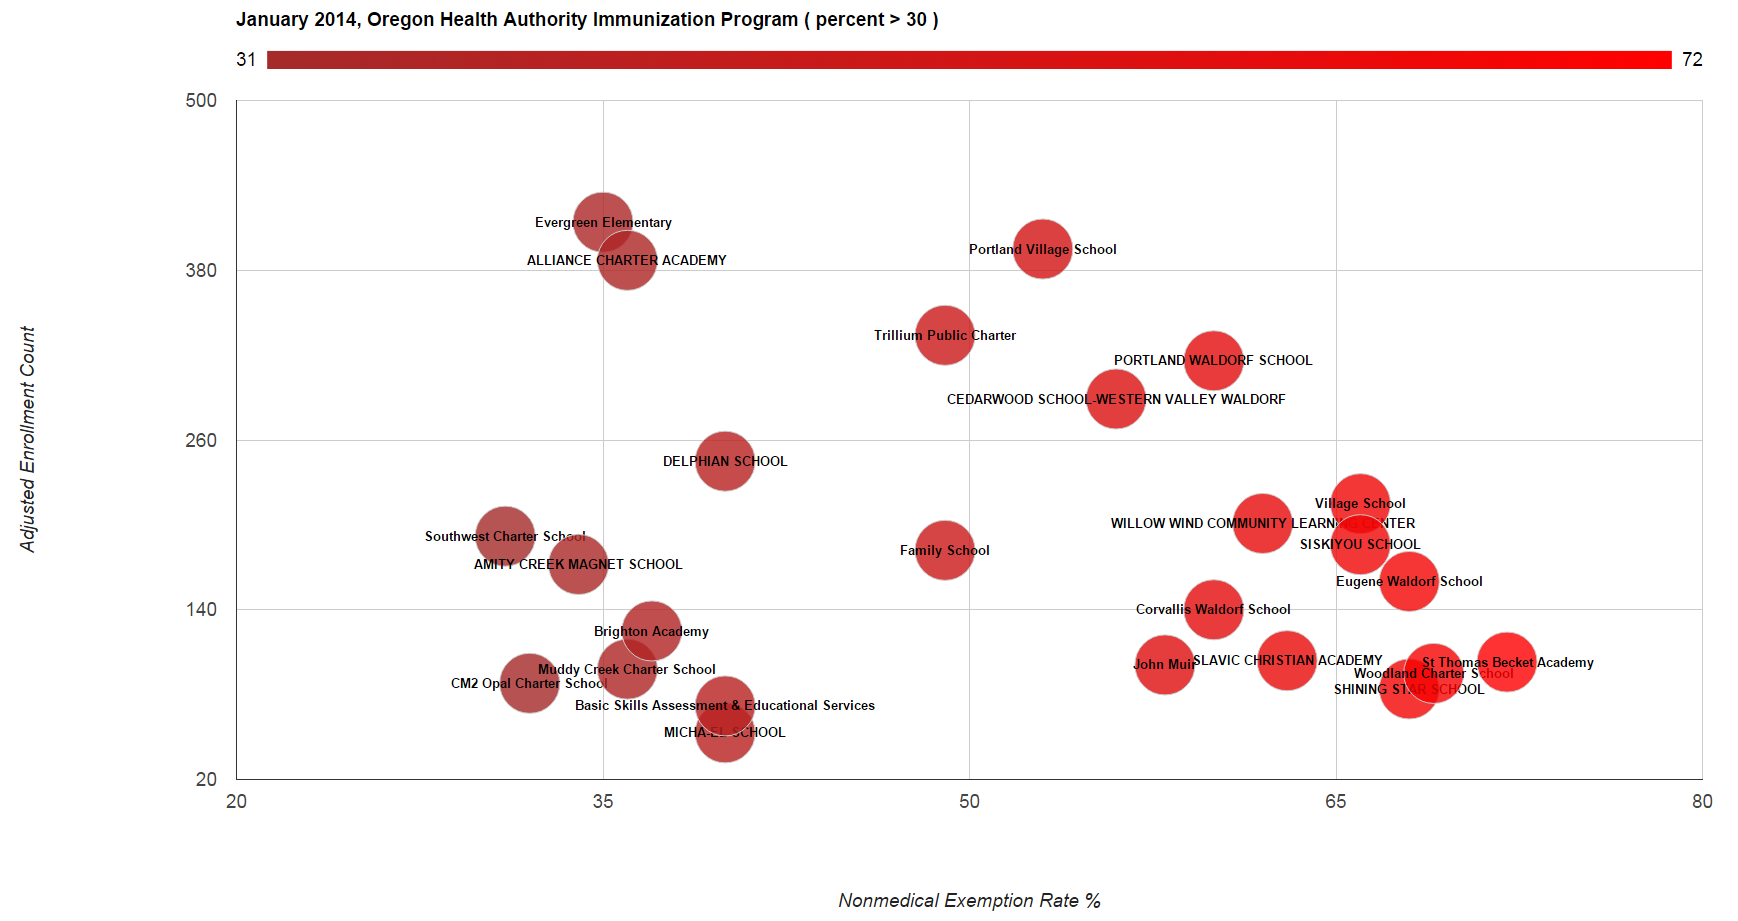
Nonmedical Exemption Rate Greater than 30 Percent
School Names with largest percentage of unvaccinated.
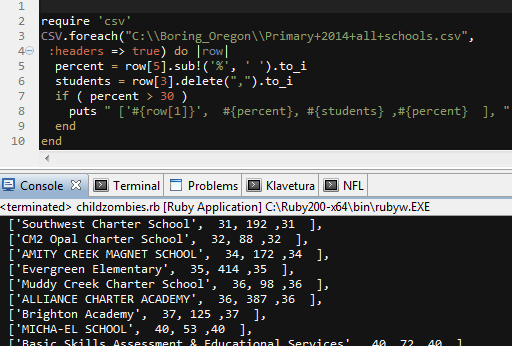
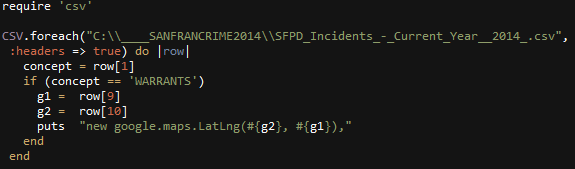
Ruby Example:
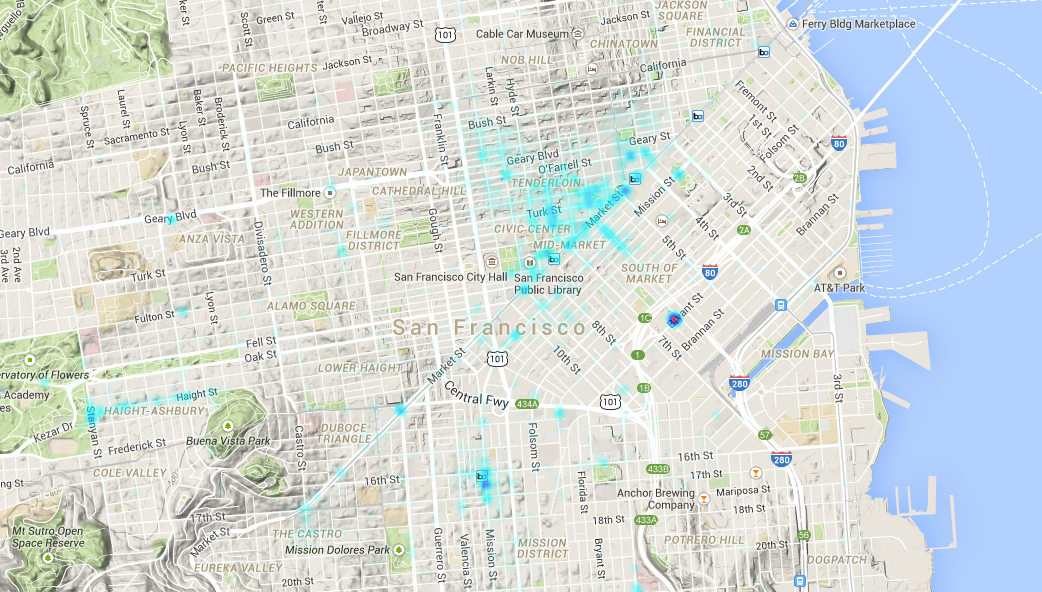
In this post I parse out specific crime category coordinates from the 2014 SFPD data found here, and plot them on some google maps.
Drugs
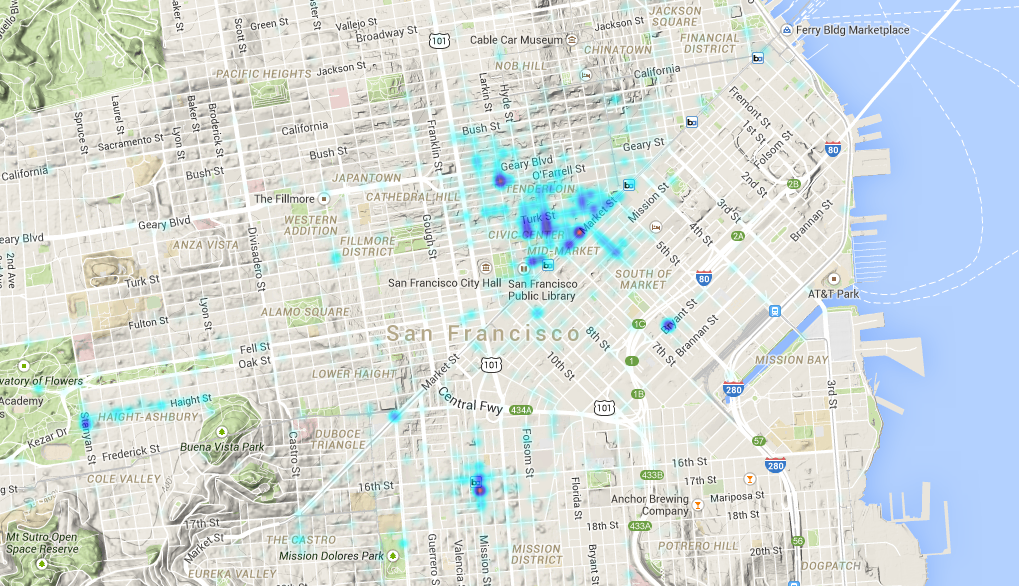
Drunks
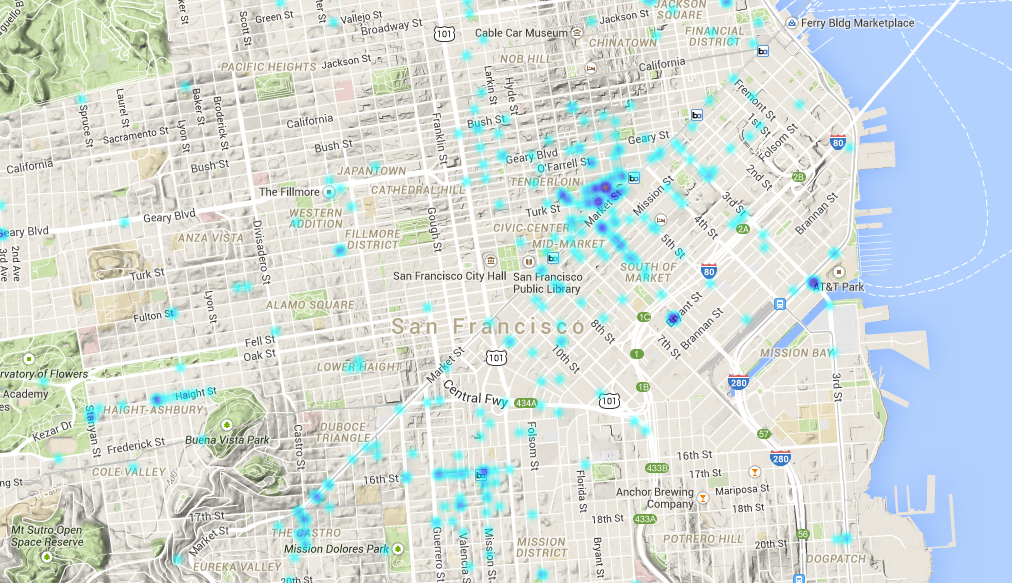
Prostitutes
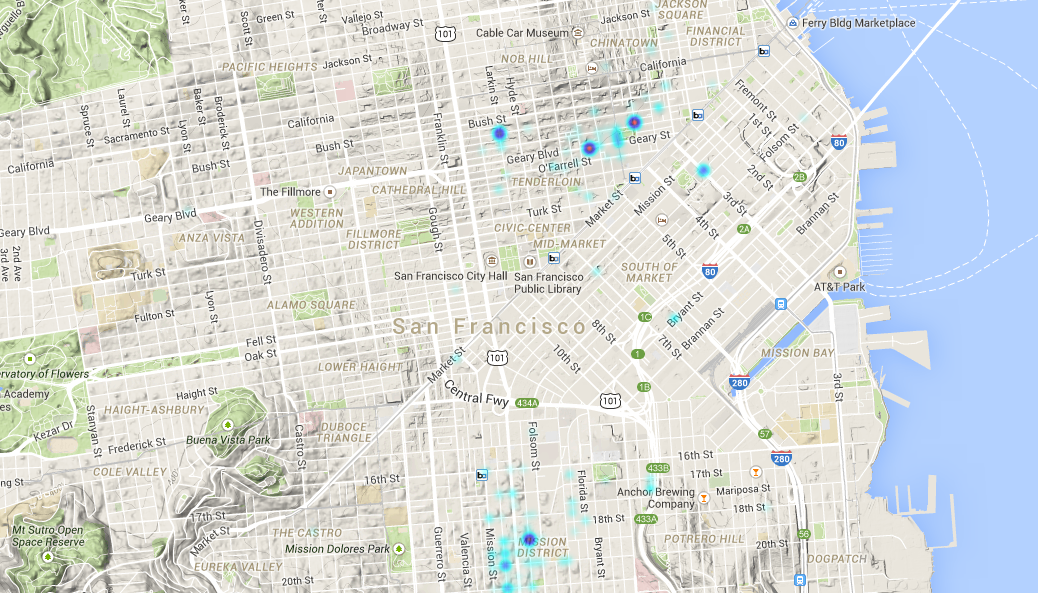
Warrants
Ruby Example:
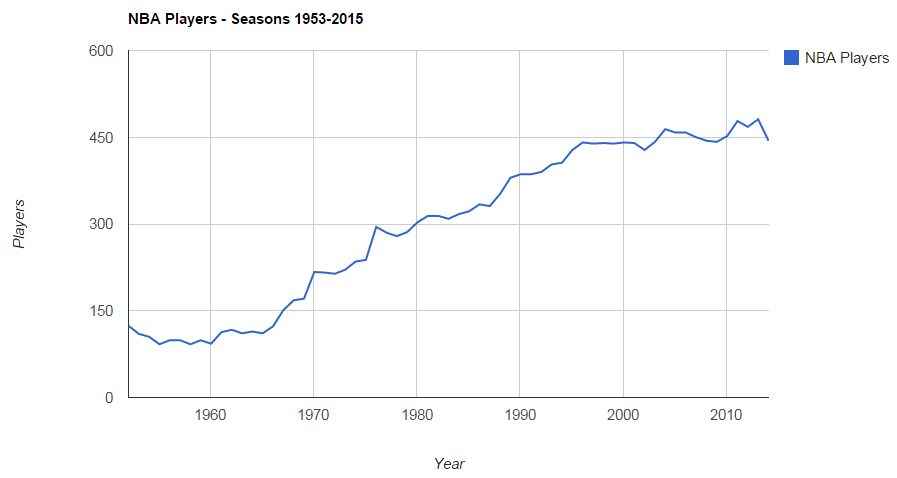
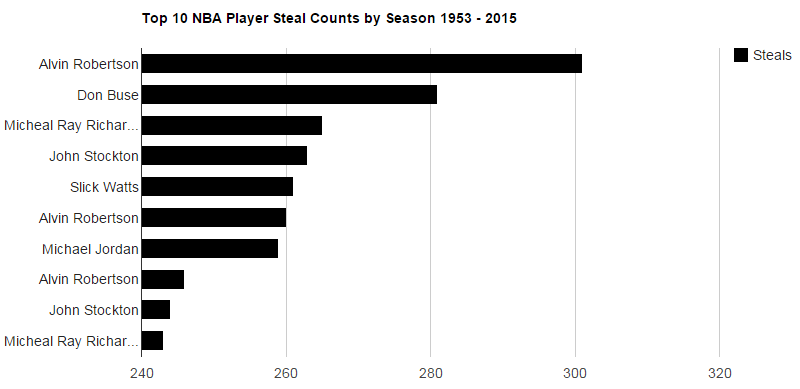
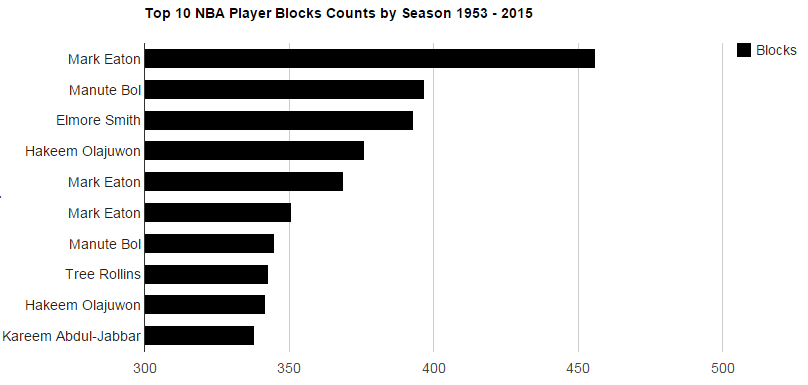
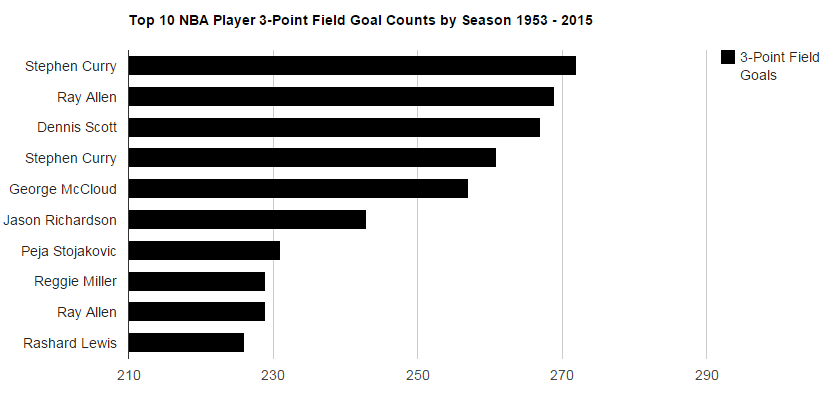
Data is from here scarped from Basketball-Reference.com . Found on reddit.com/r/datasets
Total Player Counts by Season
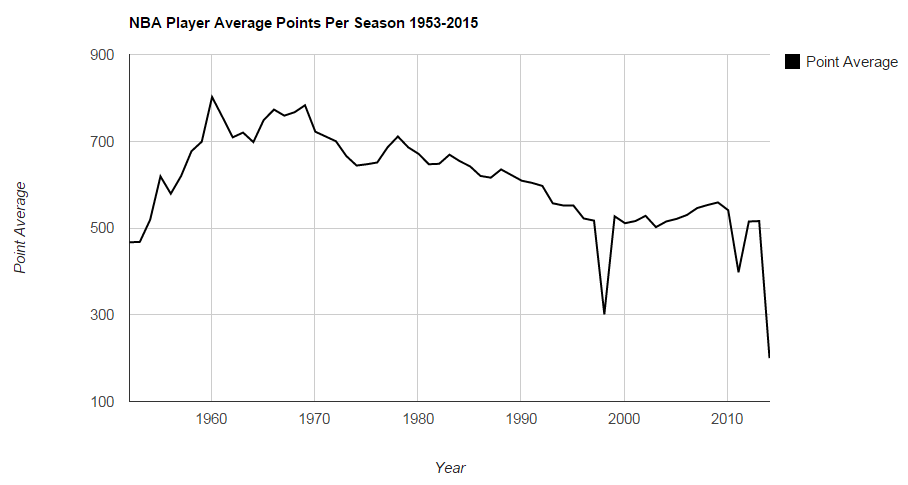
Player Average Points By Season
Top Ten Stealers, Blockers, and 3 Point Field Goalers by Season.
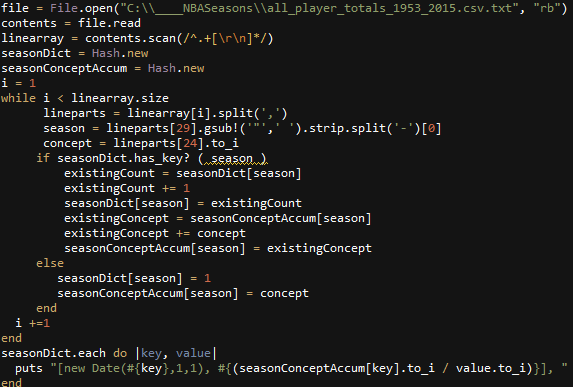
Ruby used to parse seasonal averages
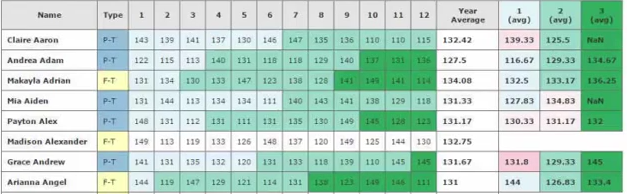
Random Empoloyees were created.
Random work hours for each month of 2014 were generated.
Random designations employment type attributed.
Random Measurement (start dates) associated.
6 Month look-back period.
ASP.net winforms was used to pull data from SQL Server.
C# was used to glue together an HTML table.
CSS was used to emphasize transitional employee types.
Employee Control Systems
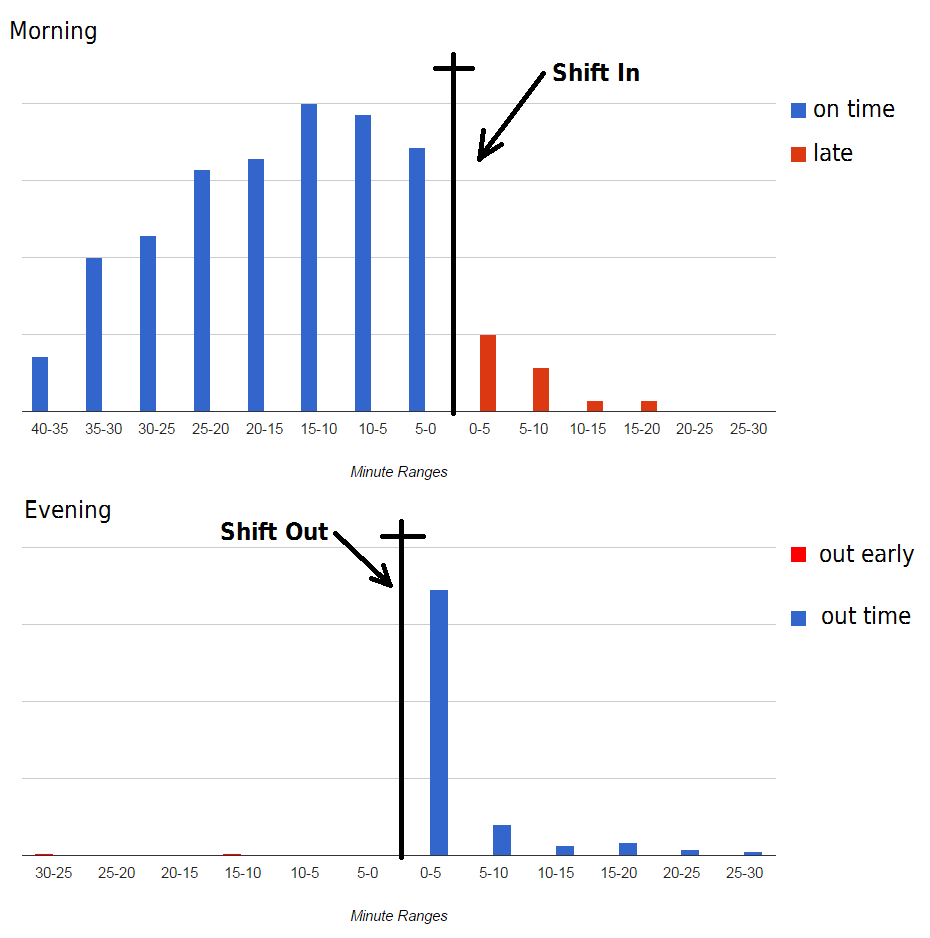
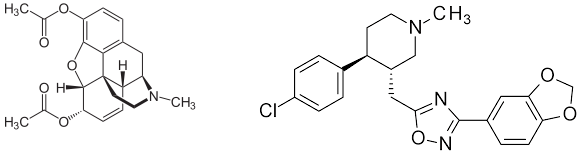
In this post I look into Chicago Police Department’s enforcement of two particular narcotics report types: Heroin and Crack Cocaine. I was curious to see yearly migrations of CPD’s activity from 2003 to 2014 in the west side region of Chicago.
The Data is from City of Chicago Data Portal
Links to youtube video animated heatmaps (some mobile devices don’t support embedded videos on my site):
http://www.youtube.com/watch?v=2qGPhlBGWxQ
http://www.youtube.com/watch?v=uh22pGBLgYo
http://www.youtube.com/watch?v=czoofaWOAps
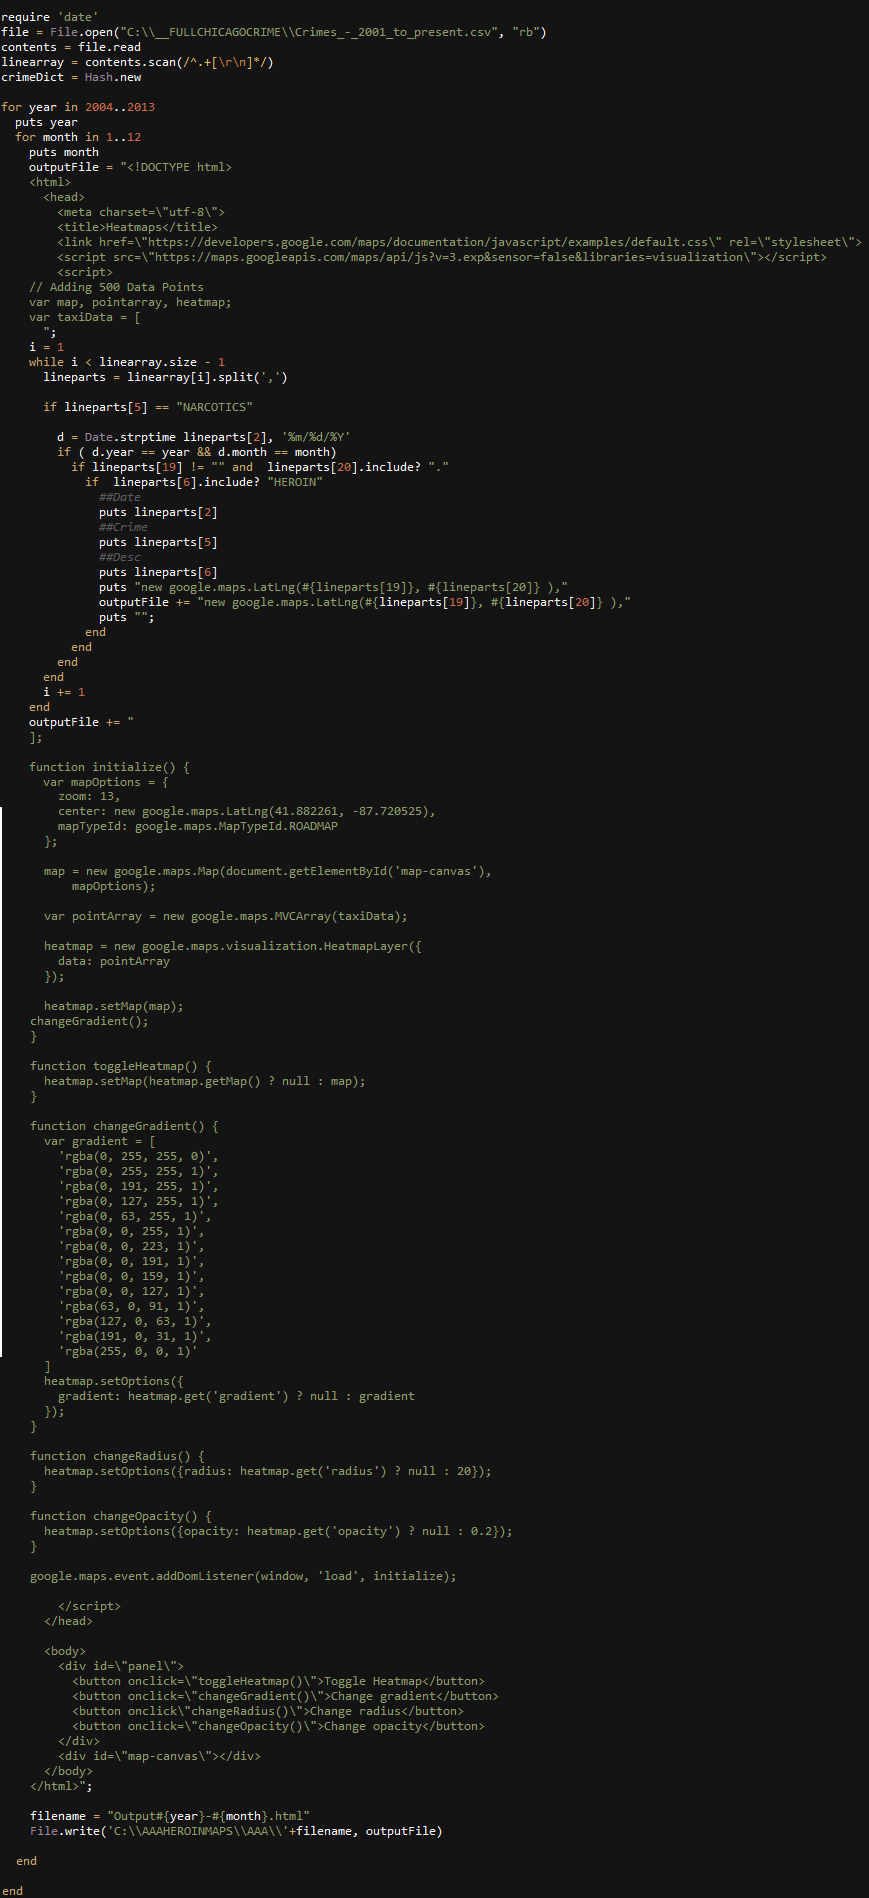
Ruby was used to parse the data and convert into JSON.
Google Heatmaps API was used to generate the maps.
Camtasia Studio 8 was used to annotate and export the videos.
Ruby written to create monthly maps
The data was found on github here:
Military Surplus Gear
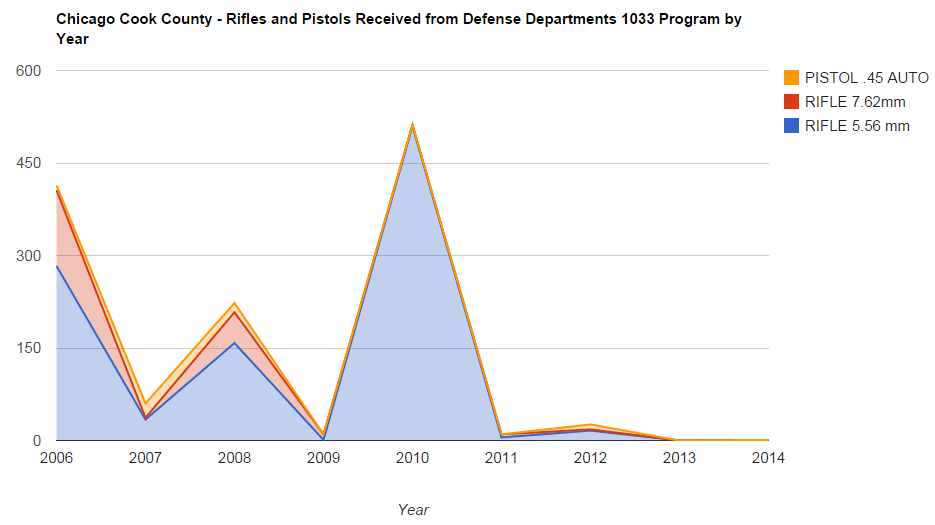
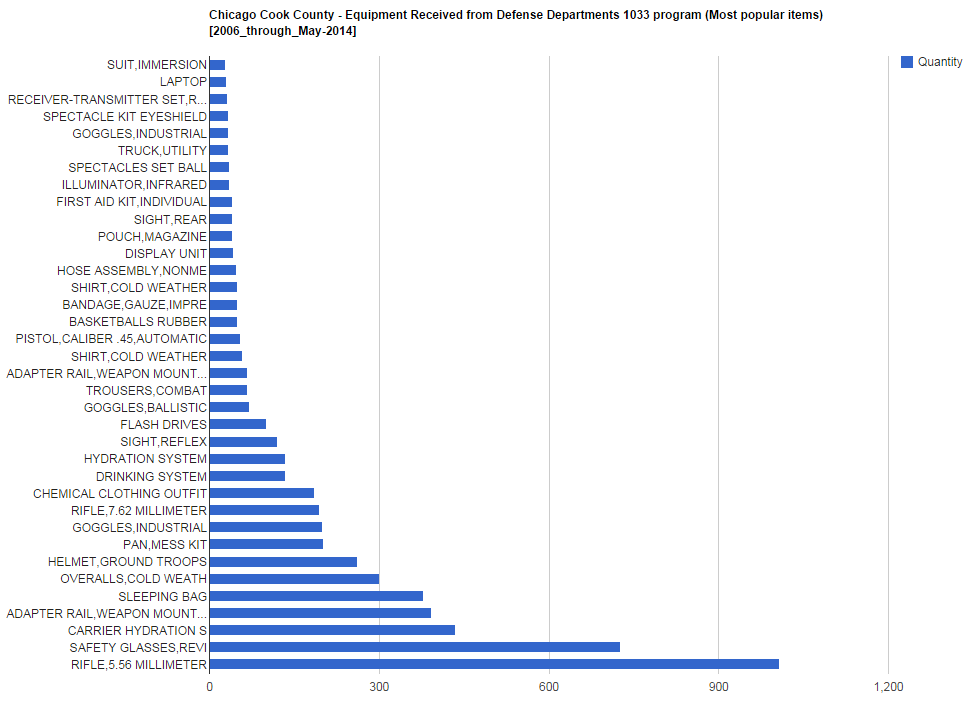
The charts below cover Chicago, IL, Cook County

This chart displays Rifles and Pistols received by year.
This graph shows most popular equipment items received from 2006 through May 2014.
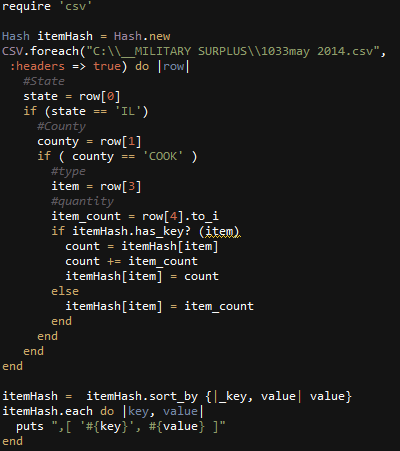
Ruby code used to parse and format the data. Google charts was used to display it.
Unreal Ed map I made in September 2008. Still played by hardcore UT engine environment trick jumpers (Think Indiana Jones temple of trials style gametype).
Current World Record 12 minutes 47 seconds, by player PIF
According to this data : Current Employee Names, Salaries, and Position Titles on City Of Chicago Data Portal https://data.cityofchicago.org/;
The Chicago government employees 32,160 employees, and pays approximately $2,429,980,941.36 in annual salaries.
Google Charts API was used.
CLICK ON Pictures FOR Focus. (temporary courtesy of imgur)
All Employees.

Let’s remove distinct Position-Titles with Less Then 10 Employees, and the position title of Police Officer from the data.

(20 or more), and, (200 or less); employee counts within a position title.

(10 or more), and,( 50 or less); employee counts within a position title.

C#
int counter = 0; string line; Dictionary<string, int> dCount = new Dictionary<string, int>(); Dictionary<string, decimal> dSalTotal = new Dictionary<string, decimal>(); Dictionary<string, LinkedList> dDeps = new Dictionary<string, LinkedList>(); System.IO.StreamReader file = new System.IO.StreamReader("C:\\AAAChicagoEmployees\\Current_Employee_Names__Salaries__and_Position_Titles (1).csv"); while ((line = file.ReadLine()) != null) { string[] parts = line.Split(','); try { string name = parts[2]; name = Regex.Replace(name, "'", ""); string dep = parts[3]; decimal sal = decimal.Parse(parts[4].TrimStart('$') ); if ( dCount.ContainsKey(name ) ) { int a = dCount[name]; a += 1; dCount[name] = a; decimal b = dSalTotal[name]; b += sal; dSalTotal[name] = b; LinkedList c = dDeps[name]; c.AddLast(dep); dDeps[name] = c; } else { dCount.Add(name, 1); dSalTotal.Add(name, sal); LinkedList newDepList = new LinkedList(); newDepList.AddLast(dep); dDeps.Add(name, newDepList); } } catch (Exception x) { //header line } counter++; } file.Close(); Dictionary<string, decimal> dAveOrder = new Dictionary<string, decimal>(); foreach (KeyValuePair<string, int> item in dCount.OrderBy(key => key.Value)) { if (item.Value >= 10 && item.Value <= 50) { decimal aveSal = dSalTotal[item.Key] / item.Value; dAveOrder.Add(item.Key, aveSal); } } string json = ""; foreach (KeyValuePair<string, decimal> item in dAveOrder.OrderBy(key => key.Value)) { Hashtable frequencyHash = new Hashtable(); LinkedList uniqueList = new LinkedList(); foreach (var element in dDeps[item.Key]) { if (uniqueList.Contains(element)) { int elementCount = int.Parse(frequencyHash[element].ToString()); elementCount++; frequencyHash[element] = elementCount; } else { uniqueList.AddLast(element); frequencyHash.Add(element, 1); } } int max = 0; string sMaxDep = ""; foreach (string element in frequencyHash.Keys) { int iDep = int.Parse(frequencyHash[element].ToString()); if (iDep > max) { max = iDep; sMaxDep = element; } } if (item.Key == "POLICE OFFICER") { } else { json += "[ '" + item.Key + "', " + dCount[item.Key] + " , " + item.Value + " ,'" + Regex.Replace(sMaxDep, "'", "") + "' , " + item.Value + " ],\r\n"; } } System.IO.StreamWriter fileWrite = new System.IO.StreamWriter("c:\\AAAChicagoEmployees\\data.txt"); fileWrite.WriteLine(json); fileWrite.Close(); |