
Each crime report contains latitude and longitude coordinates. I used ruby to parse out each coordinate from this source : https://data.cityofchicago.org. Then I appended those points into a heat map.
Update: This dataset has been expanded on, in this post DataViz: Visualizing Chicago Narcotics Crime Data.
Chicago DECEPTIVE PRACTICE – 8/8/2012 to 8/8/2013
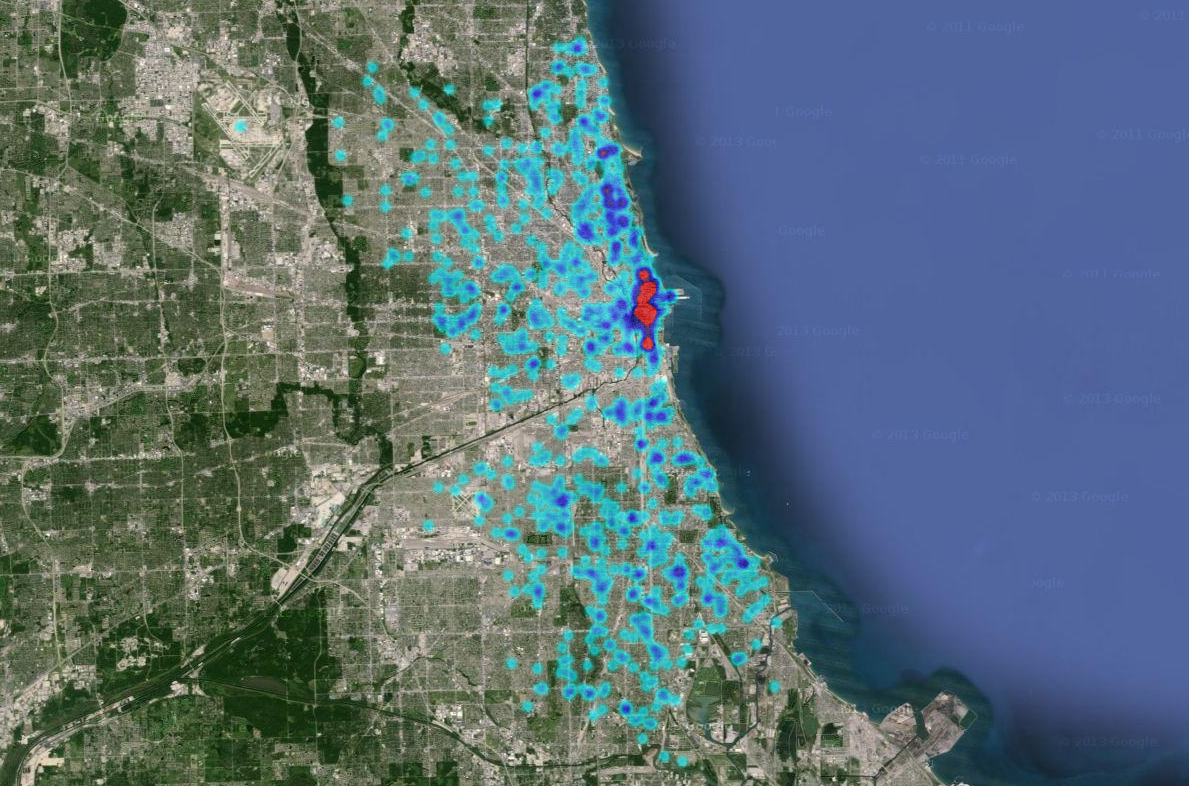
Chicago ALL CRIMES – 8/8/2012 to 8/8/2013

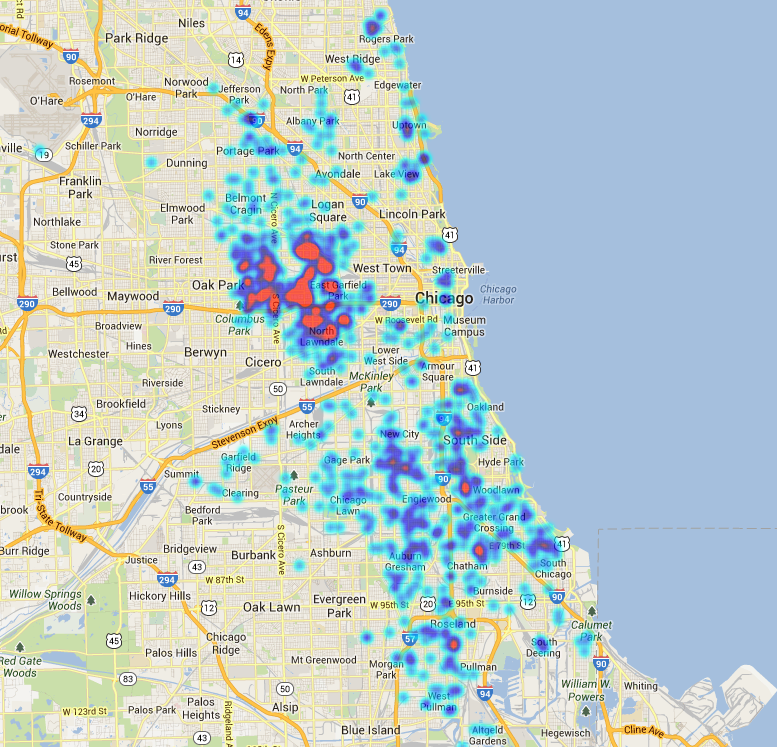
Chicago NARCOTICS – 8/8/2012 to 8/8/2013
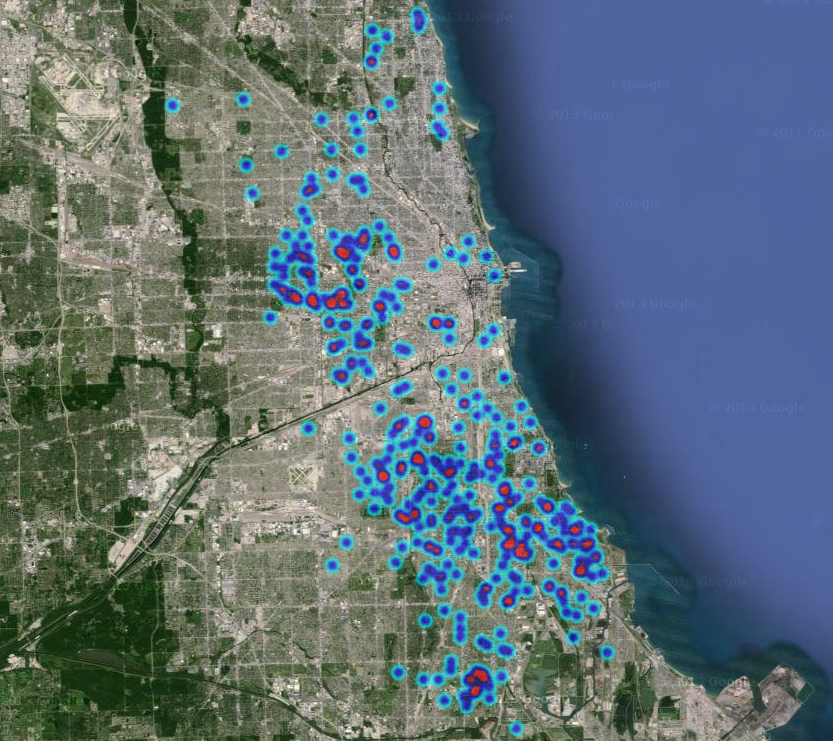
Chicago HOMICIDE – 8/8/2012 to 8/8/2013
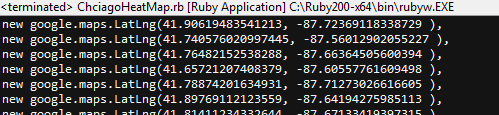
Ruby example to parse all coordinates for Primary Crime Type: DECEPTIVE PRACTICE
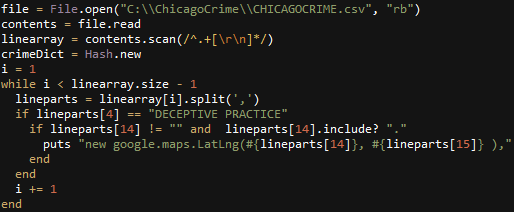
Output
I like these charts. As a chart man, I must say you’ve done your research and it shows.
Nice. Finally a map that shows me where to get good narcotics in Chicago!
Very curious you would conclude this identifies where one could purchase good narcotics. To me, that looks like a map of where drug dealers are stupid. Good, smart criminals don’t get caught–just look at Congress.