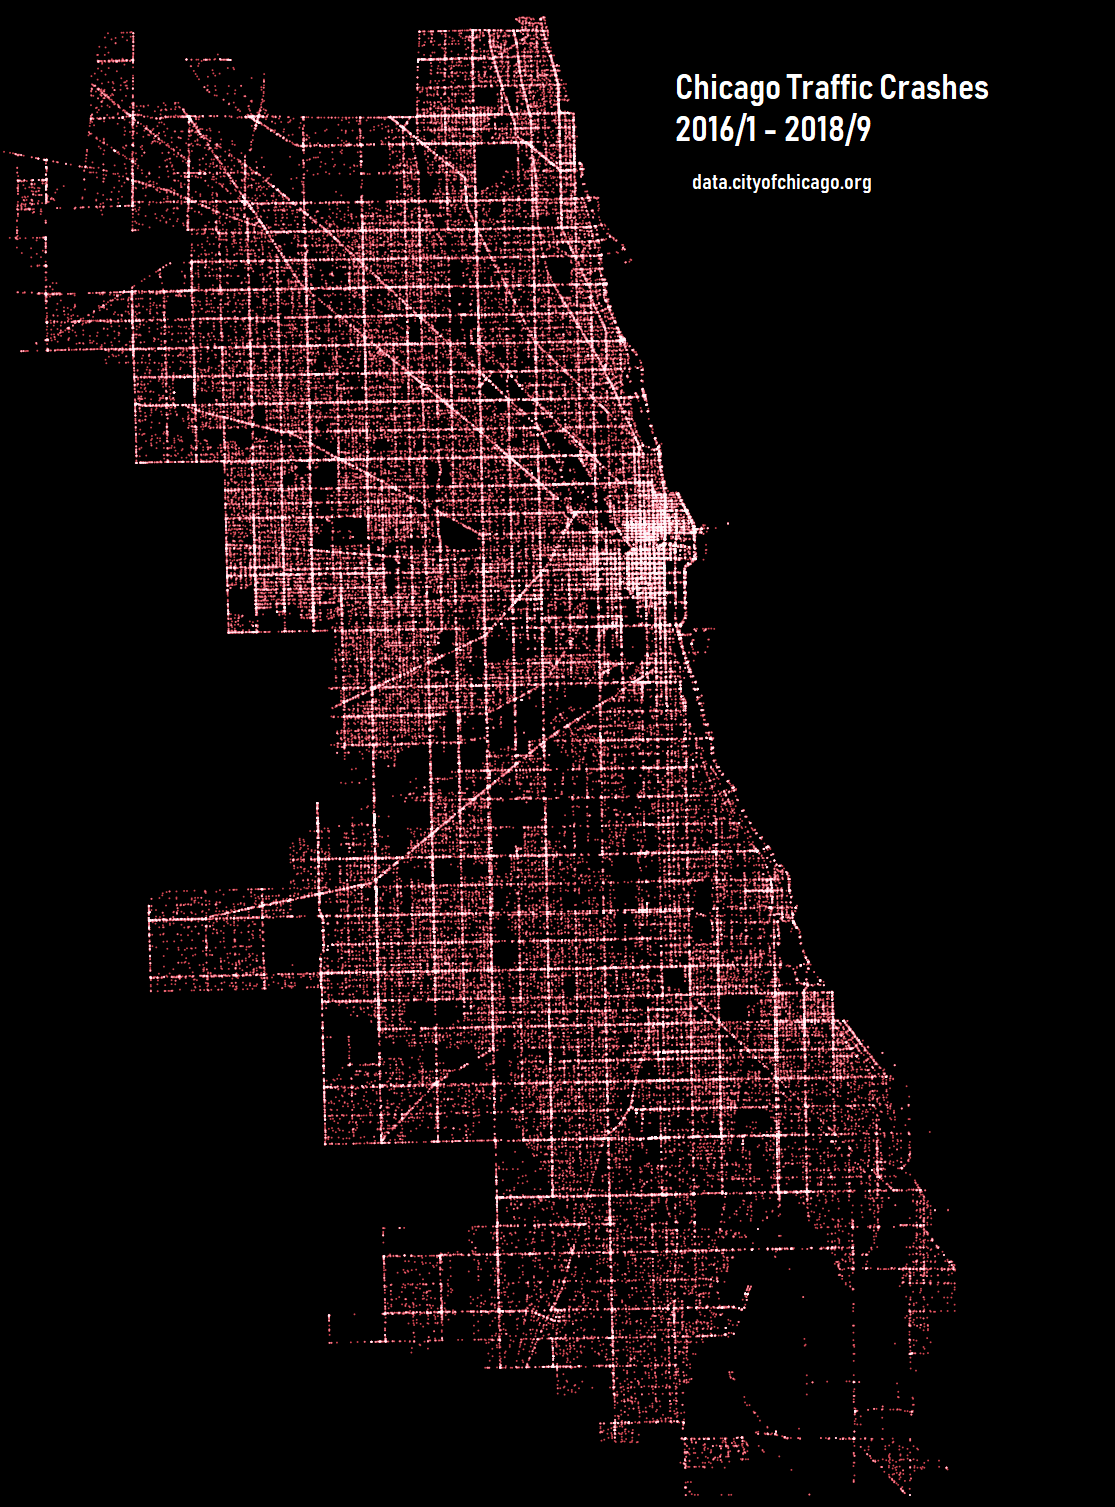
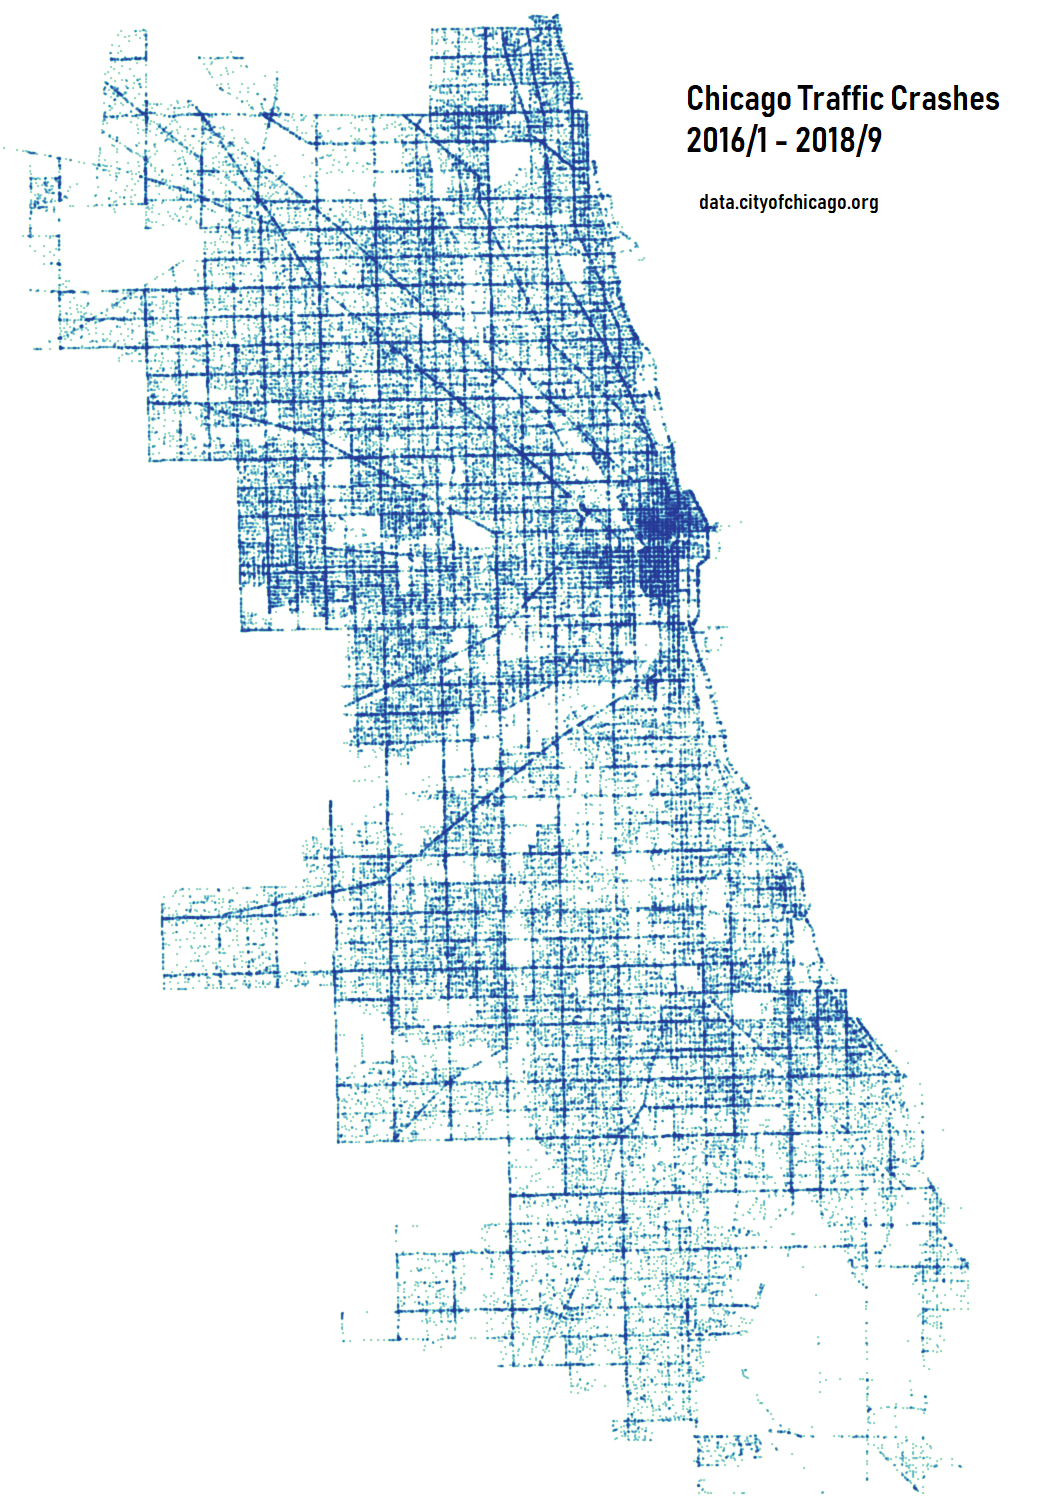
Point and heat maps of Chicago created by plotting coordinates of traffic crashes. Time range used, spans from January 2016 through September 2018. The data can be found at data.cityofchicago.org.
Crash data shows information about each traffic crash on city streets within the City of Chicago limits and under the jurisdiction of Chicago Police Department (CPD).
Click on map images below to enlarge.