
In response to an /r/datavizrequests submission, where a user provided this dataset, and requested a relationship mapping. I created a few visualizaitons using a web visualization library called D3.js. I used Mike Bostock’s Chord example to render these Chord Charts.
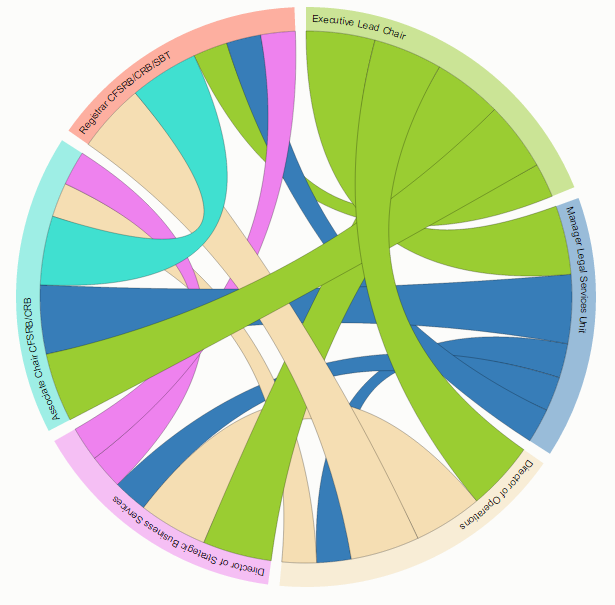
6 Concepts
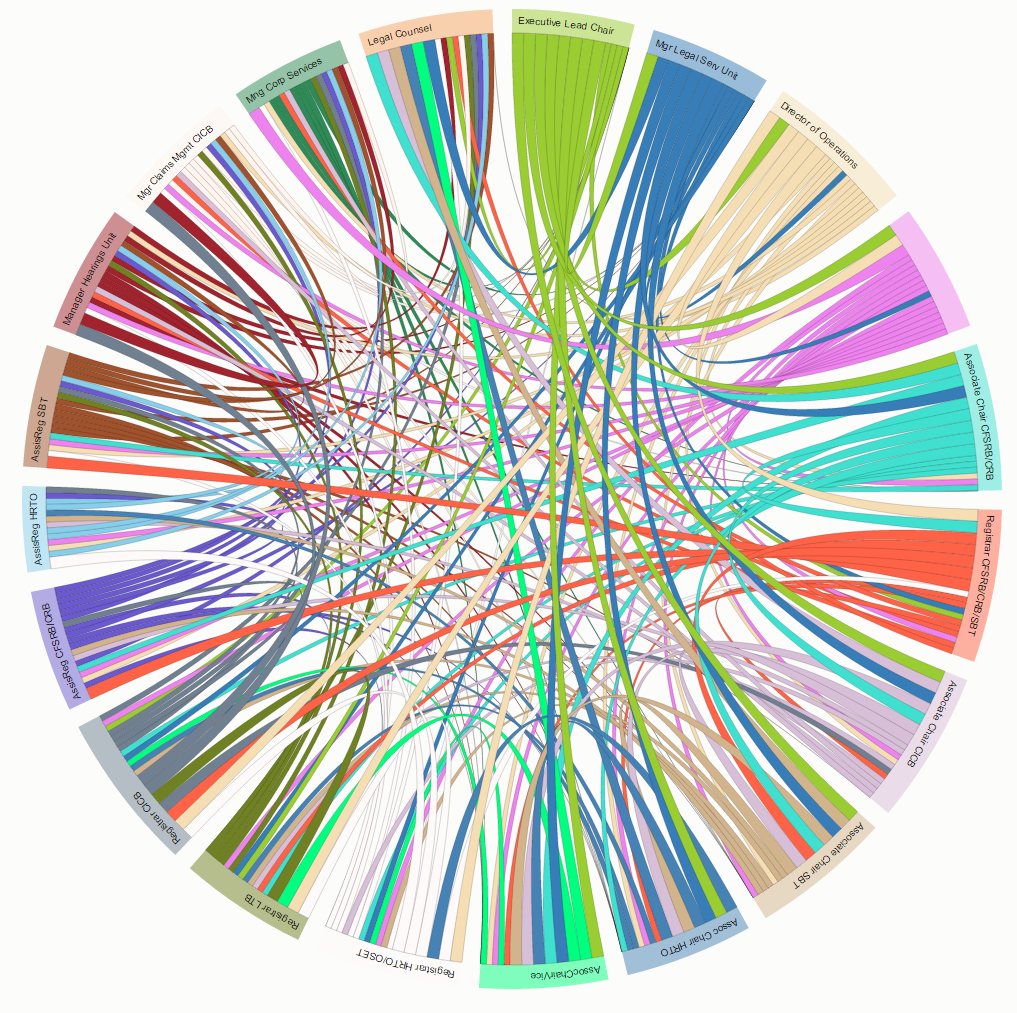
20 Concepts
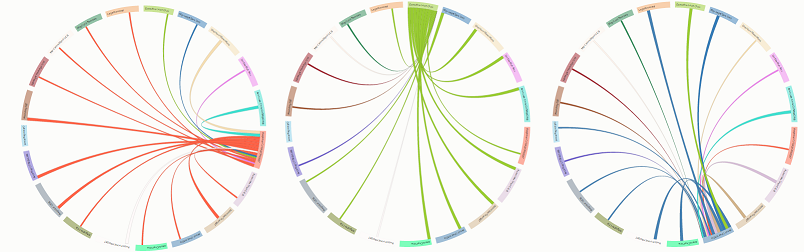
Here is a link to the interactive version. Highlighting a concept will isolate its relationships.


Is graphing something like this possible for someone with no coding experience?
I’m trying to put together a diagram showing the collaborative relationships between 29 different faculty. We have 5 different categories of relationships, and each of the faculty identified which categories apply to each of the other 28 faculty. Any suggestions/ideas for how to get started?