I made a video of PARSING HTML USING REGULAR EXPRESSIONS.
Here is the wordcloud image result of Rule 14 violations.
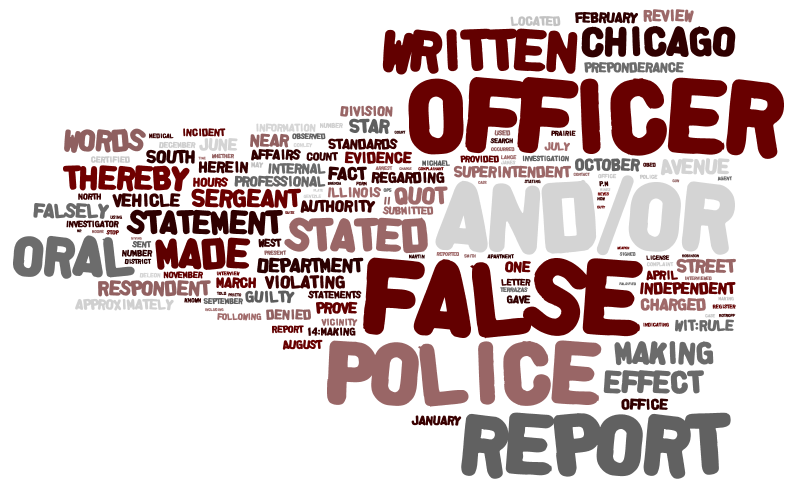
Here is the video with commentary of how I made it.

I made a video of PARSING HTML USING REGULAR EXPRESSIONS.
Here is the wordcloud image result of Rule 14 violations.
Here is the video with commentary of how I made it.
The data is from seanlahman.com.
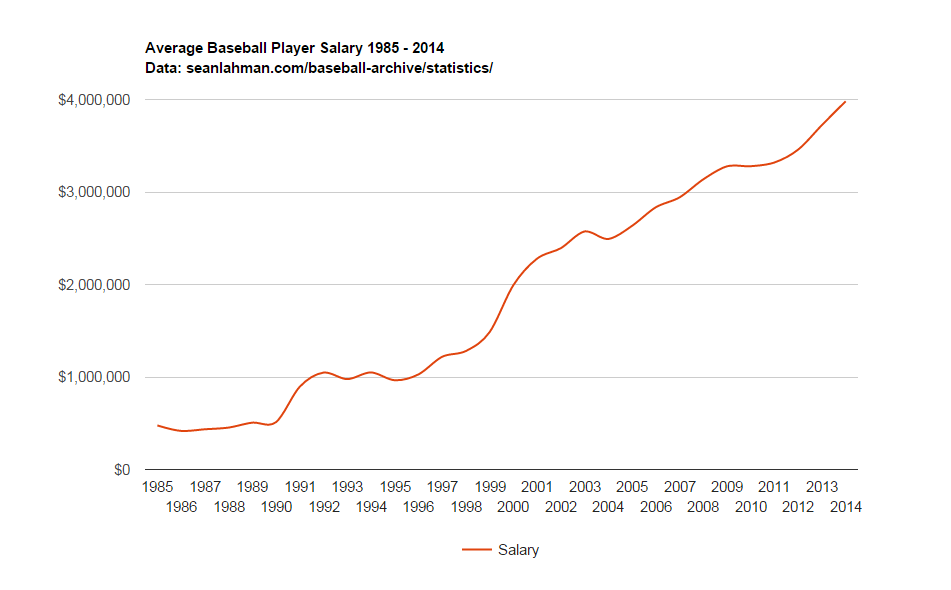
C# Console Application written to parse the csv dataset and create json output for a google charts line graph.
Continue reading
Another fun project using Processing.

The behavior is slightly different from my previous Processing submission. However, this time the snakes are afraid of black walls, and if they head in the direction of a wall, they turn around in the opposite direction.
Sweet visualization thingy here https://processing.org/.
I made a video.
https://vimeo.com/139664336
Code written using the rectangle class.
Continue reading
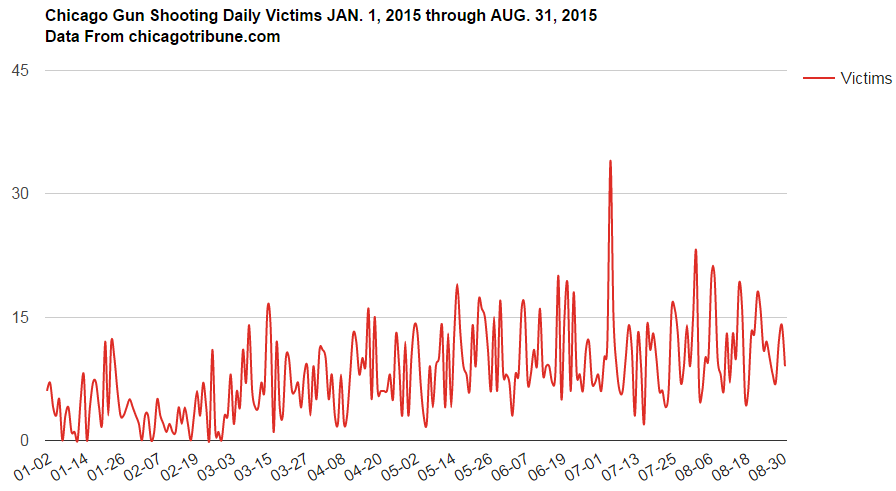
A different take on Chicago Tribune’s Gun Shooting visualizations. Time Range: JAN. 1, 2015 through AUG. 31, 2015.
The data was obtained and parsed from the Trib http://crime.chicagotribune.com/chicago/shootings
I made a daily line chart using Google Charts, and an overall intensity map using CartoDB.

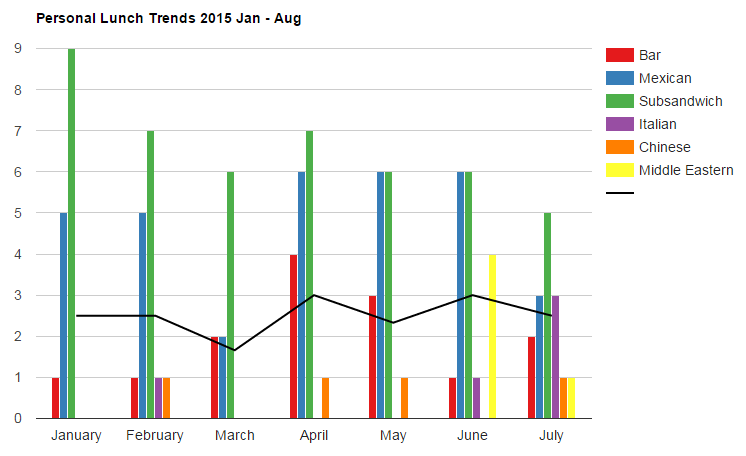
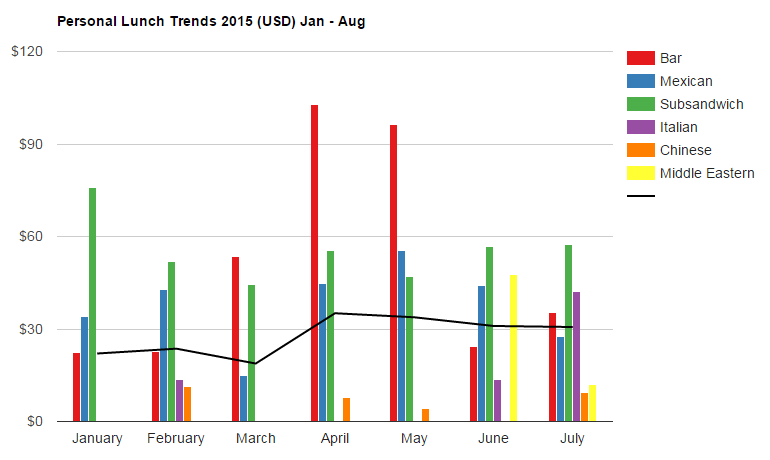
So I decided to parse out where I go to lunch on a regular workday. Working downtown in the city(USA), I walk to get lunch-in-a-bag somewhere within a short radius of the office. My decision of where I choose to go to lunch can be categorized like so: Sub sandwich, Chinese, Mexican, Italian, Middle Eastern, or Bar.
Everyday, I struggle making a decision. Everyday, only one choice is made.
Frequency
Monetary
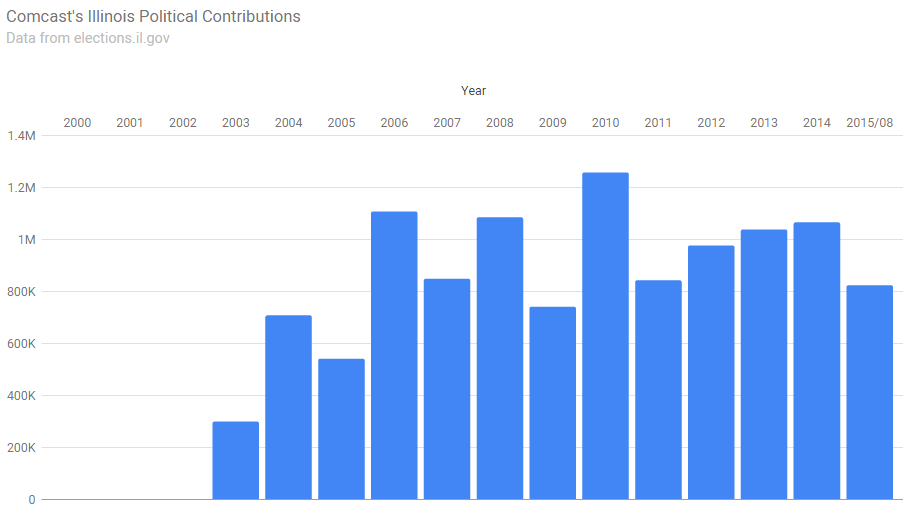
I found an interesting dataset on political contributions in the state of Illinois.. The downloadable .zip contains multiple tab delimited database files which contain the relationships between Donations, Committees, and Candidates.
Out of curiosity in seeing Comcast’s political influence in Illinois over time, I parsed the 650,775mb file called Receipts.txt. Below is a bar chart of yearly recorded donation totals from 2000 through 2015-08.
Not being very politically oriented, I wanted to somehow relate the donations to candidates. But in the form of the available data, it appears Donors make contributions to Committees, and Committees support a Candidate. But I do not know if Candidates and Committees are a One to One relationship at the time of typing this.
Parsing the text file called CmteCandidateLinks.txt, I related the Committee Id with the candidate Id. Parsing the text file called Candidates.txt I relate the Candidate Id to the Candidate name.
Lots of candidate duplicates per donation entry. Majority of Committees represent the same candidate under different ids, while some committees represent multiple candidates. Example here:
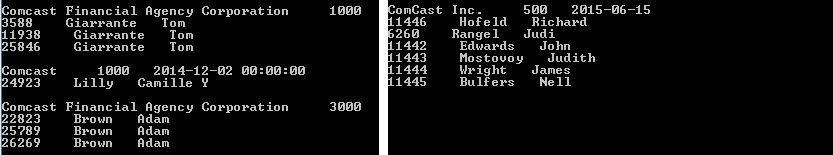
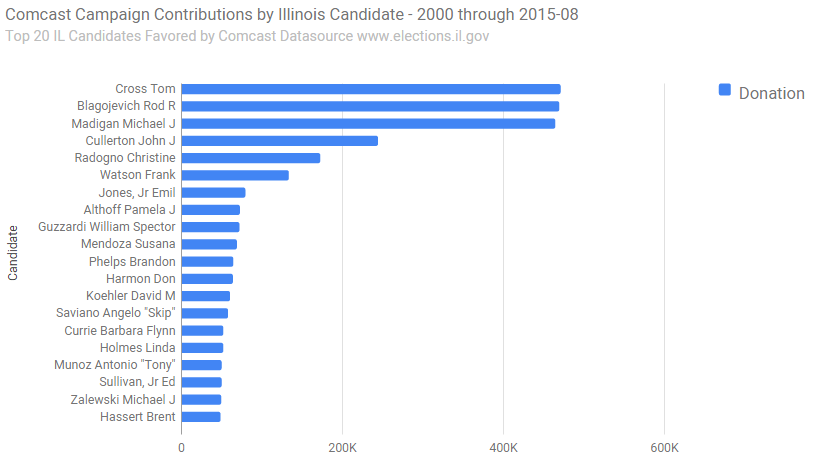
So I decided to distribute each donation amount between a potential multitude of candidates. I did this by dividing each donation by the number of candidates which belong to the committee recipient. From that, I got this list of Comcast’s Top Illinois Candidates.
I came across an interesting data set while browsing datacatalog.cookcountyil.gov. It can be found here. Judging by the title, it appears to be healthcare costs for the month of June in the year of 2012. There is no description, or any additional information I could find about it. The data contains a department code, a number of employees, and a total cost. It looks like this:
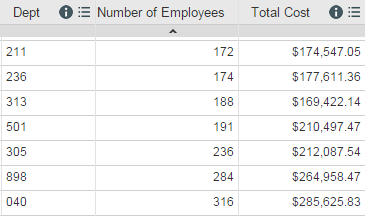
I was curious, so I took the average cost of employee count (Cost / Emp num), per department. I correlated the department numbers to labels from an alternative dataset also found on cook county’s data catalog.
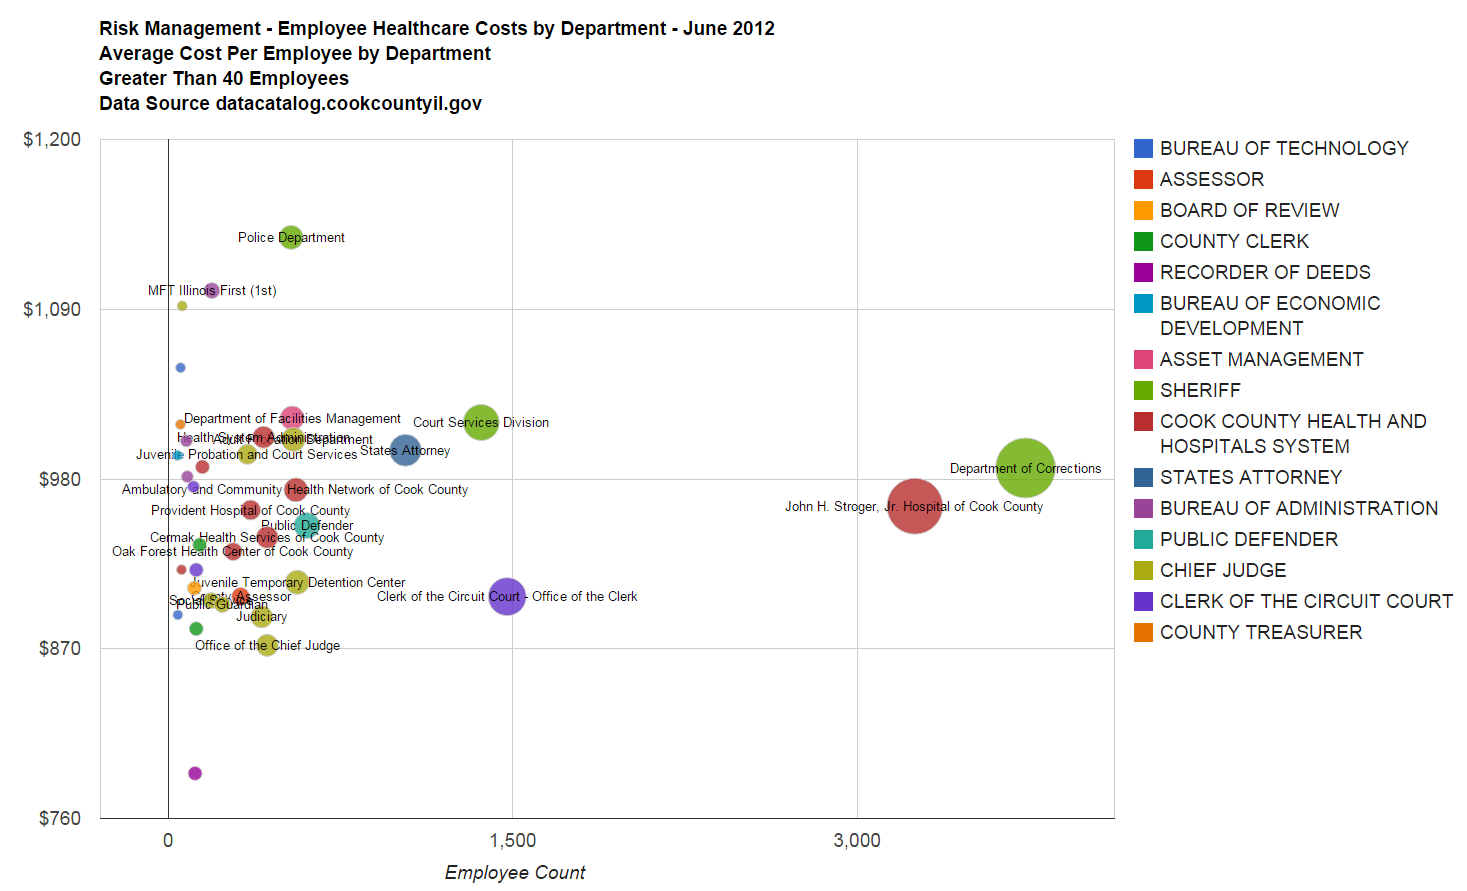
My experiment resulted in two bubble charts.
Greater than 40 Employees
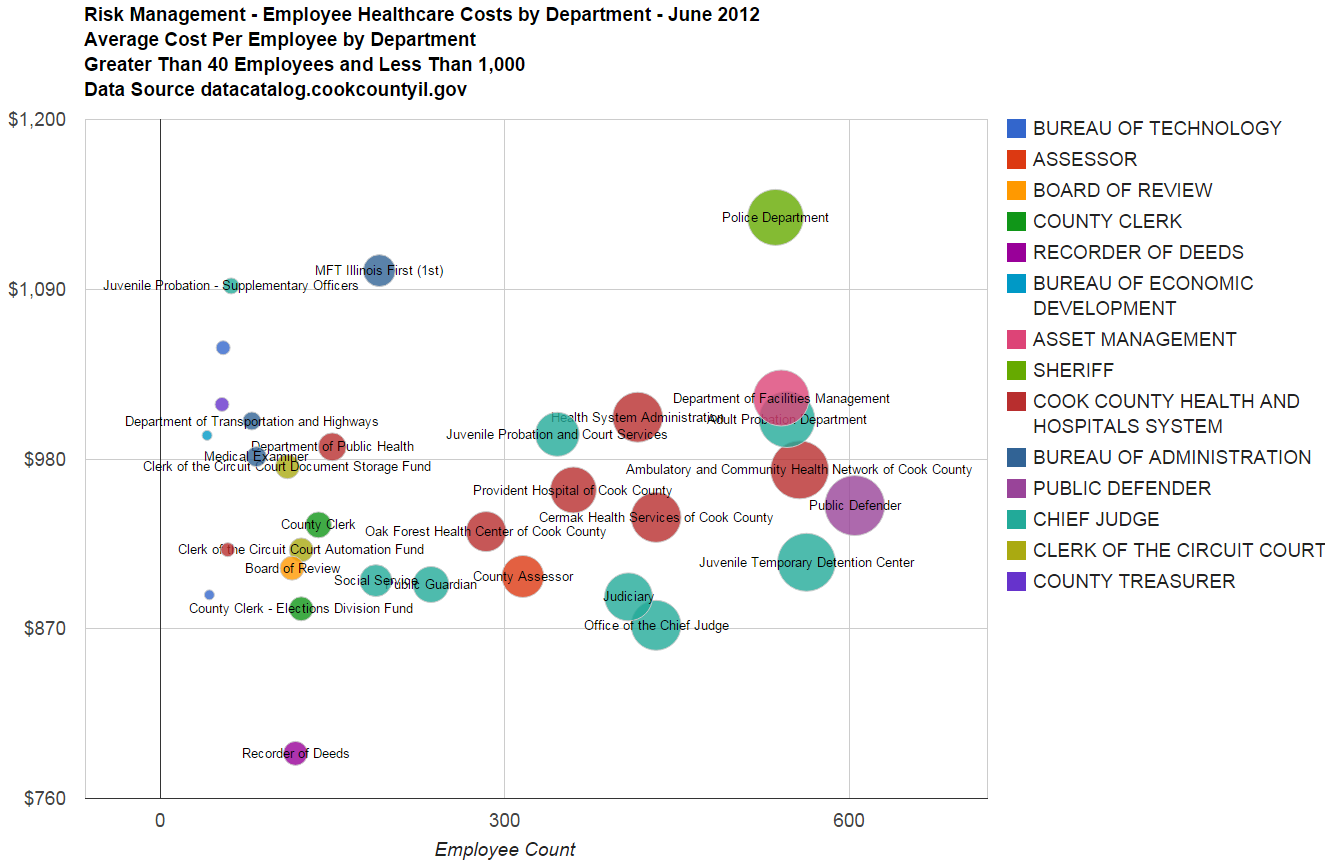
Greater than 40 Employees and less than 1,000
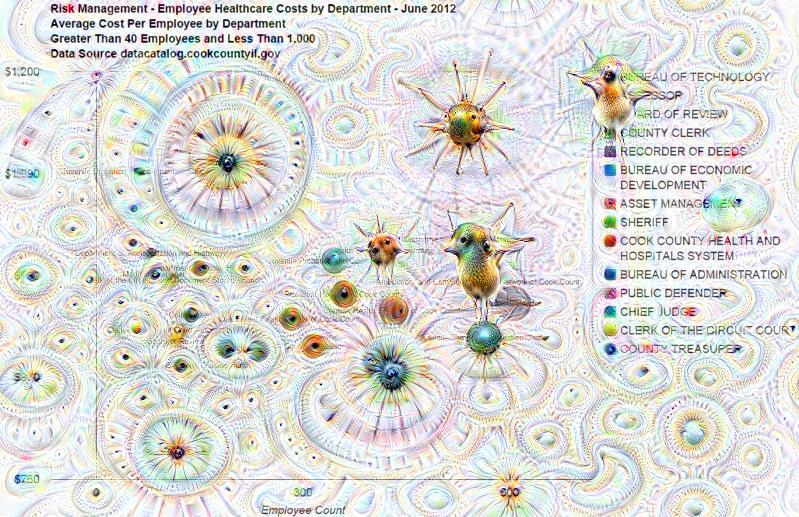
And now here’s the second chart processed with Google’s Deep Dream
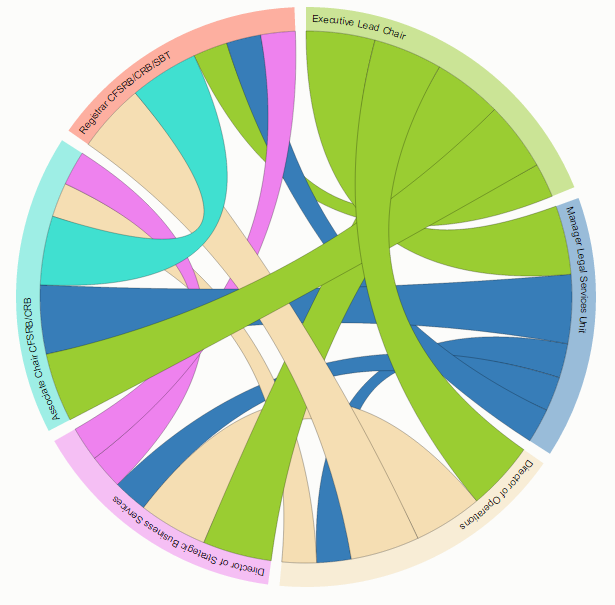
In response to an /r/datavizrequests submission, where a user provided this dataset, and requested a relationship mapping. I created a few visualizaitons using a web visualization library called D3.js. I used Mike Bostock’s Chord example to render these Chord Charts.
6 Concepts
20 Concepts
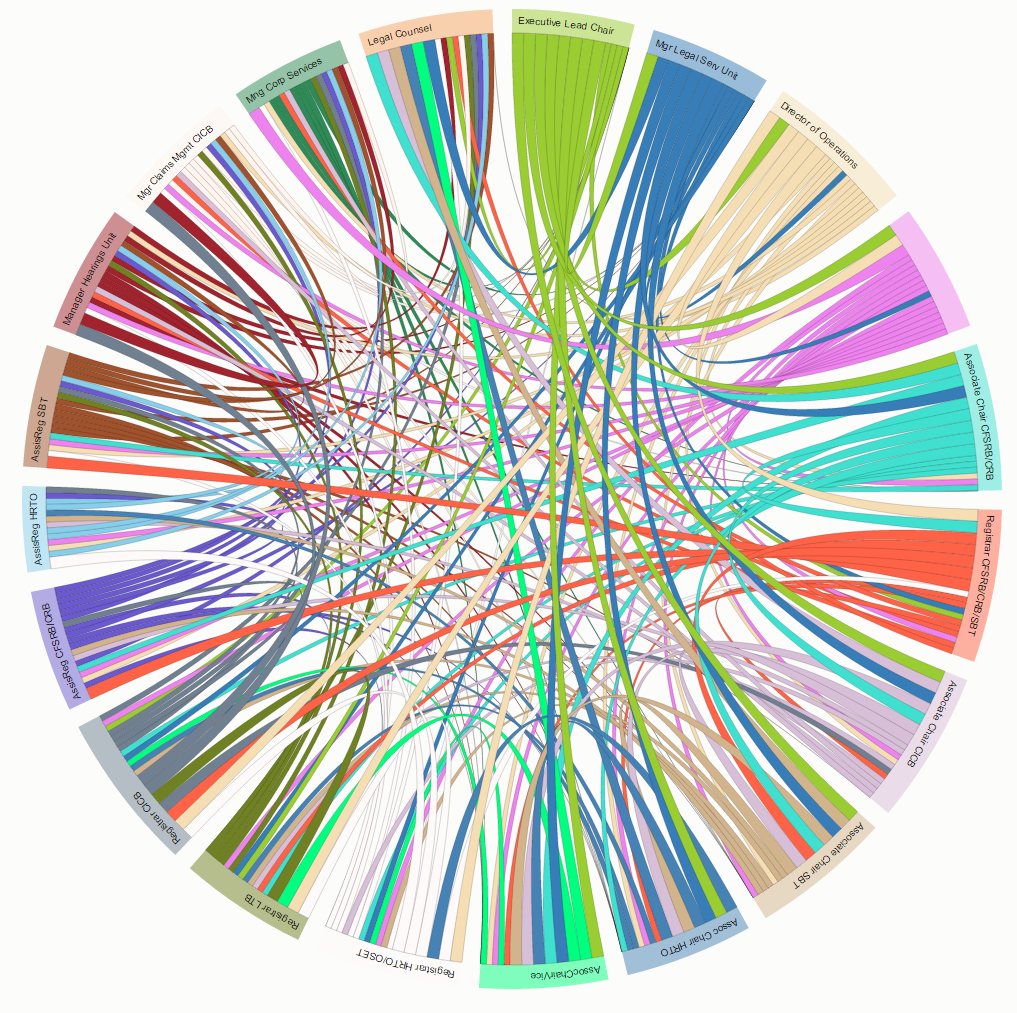
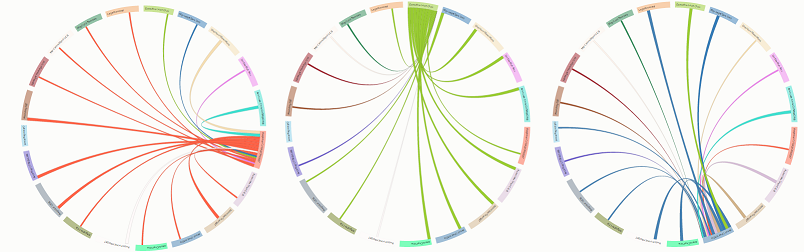
Here is a link to the interactive version. Highlighting a concept will isolate its relationships.


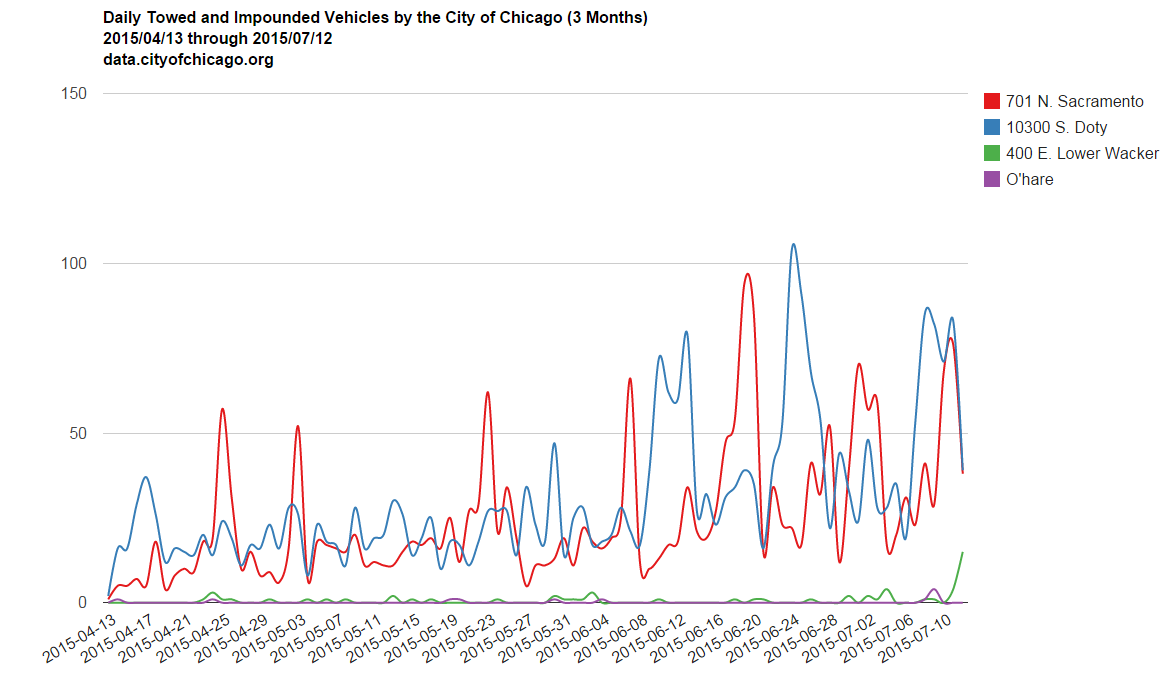
Ever have your car towed and impounded by the city? If you have, chances are it ended up in one of two locations. 701 N. Sacramento, or 10300 S. Doty.

Below is a chart which displays the daily counts of impounded vehicles per each impound location. The timeline represents data from 2015/04/13 through 2015/07/12, or roughly 3 months. The data is from data.cityofchicago.org
Older post Graphing Chicago Towed Vehicles by Brand and Color