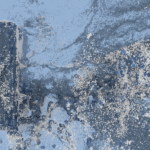
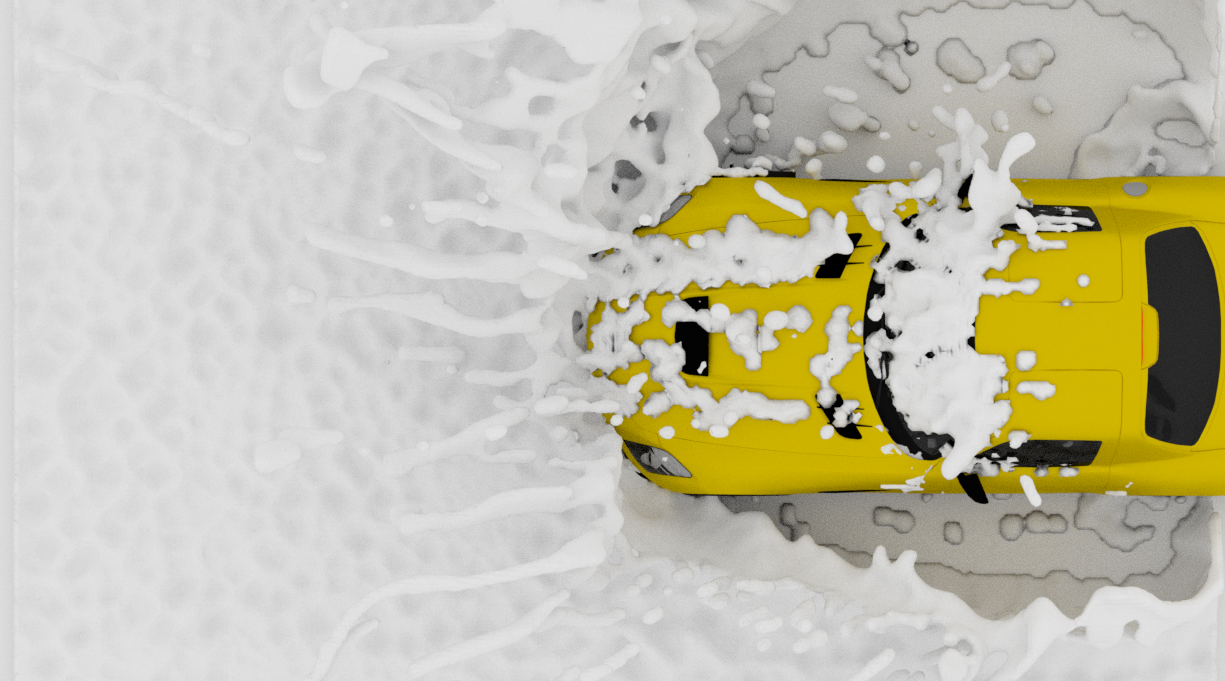
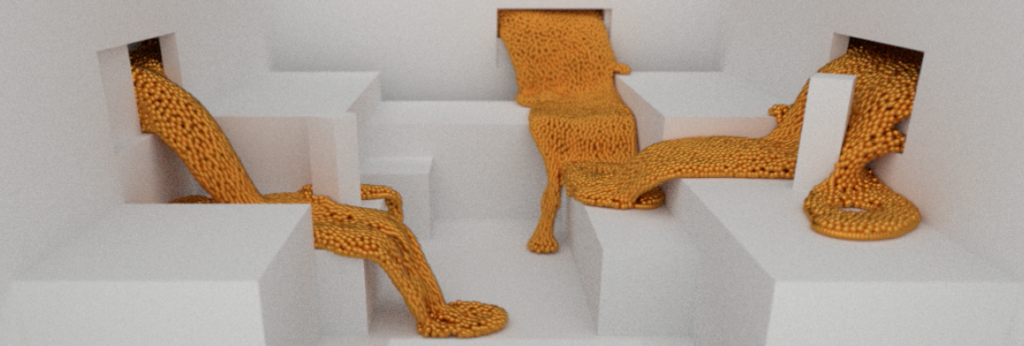
Experimenting with curling wave fluid simulations using Blender 2.8+
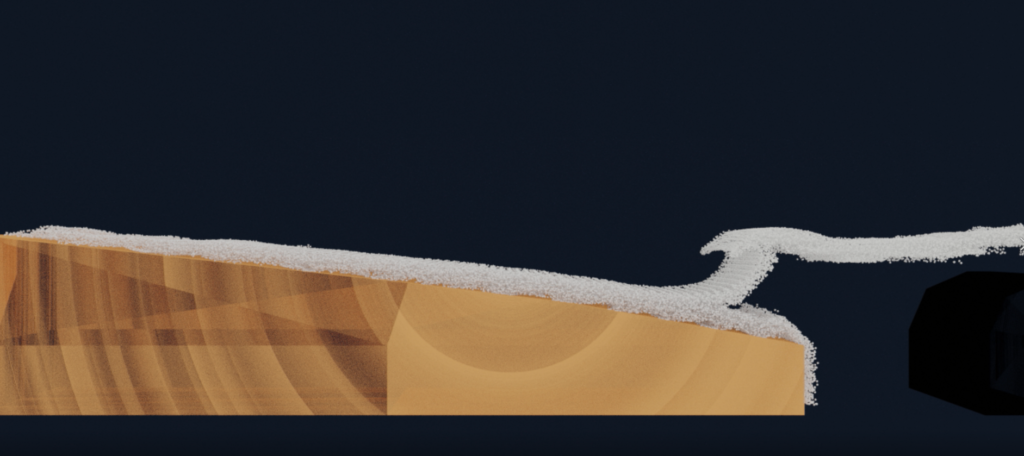
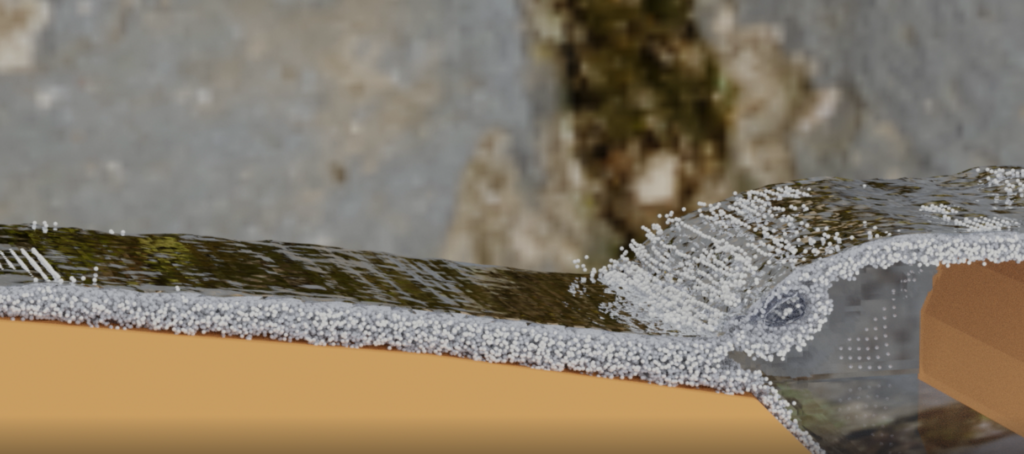

Experimenting with curling wave fluid simulations using Blender 2.8+
A look into who Reddit employees are giving money to. The data can be found at https://www.opensecrets.org/. Contribution amount is scaled to box size, and color is Party. Time range spans from 2018 into 2020.
click to enlarge

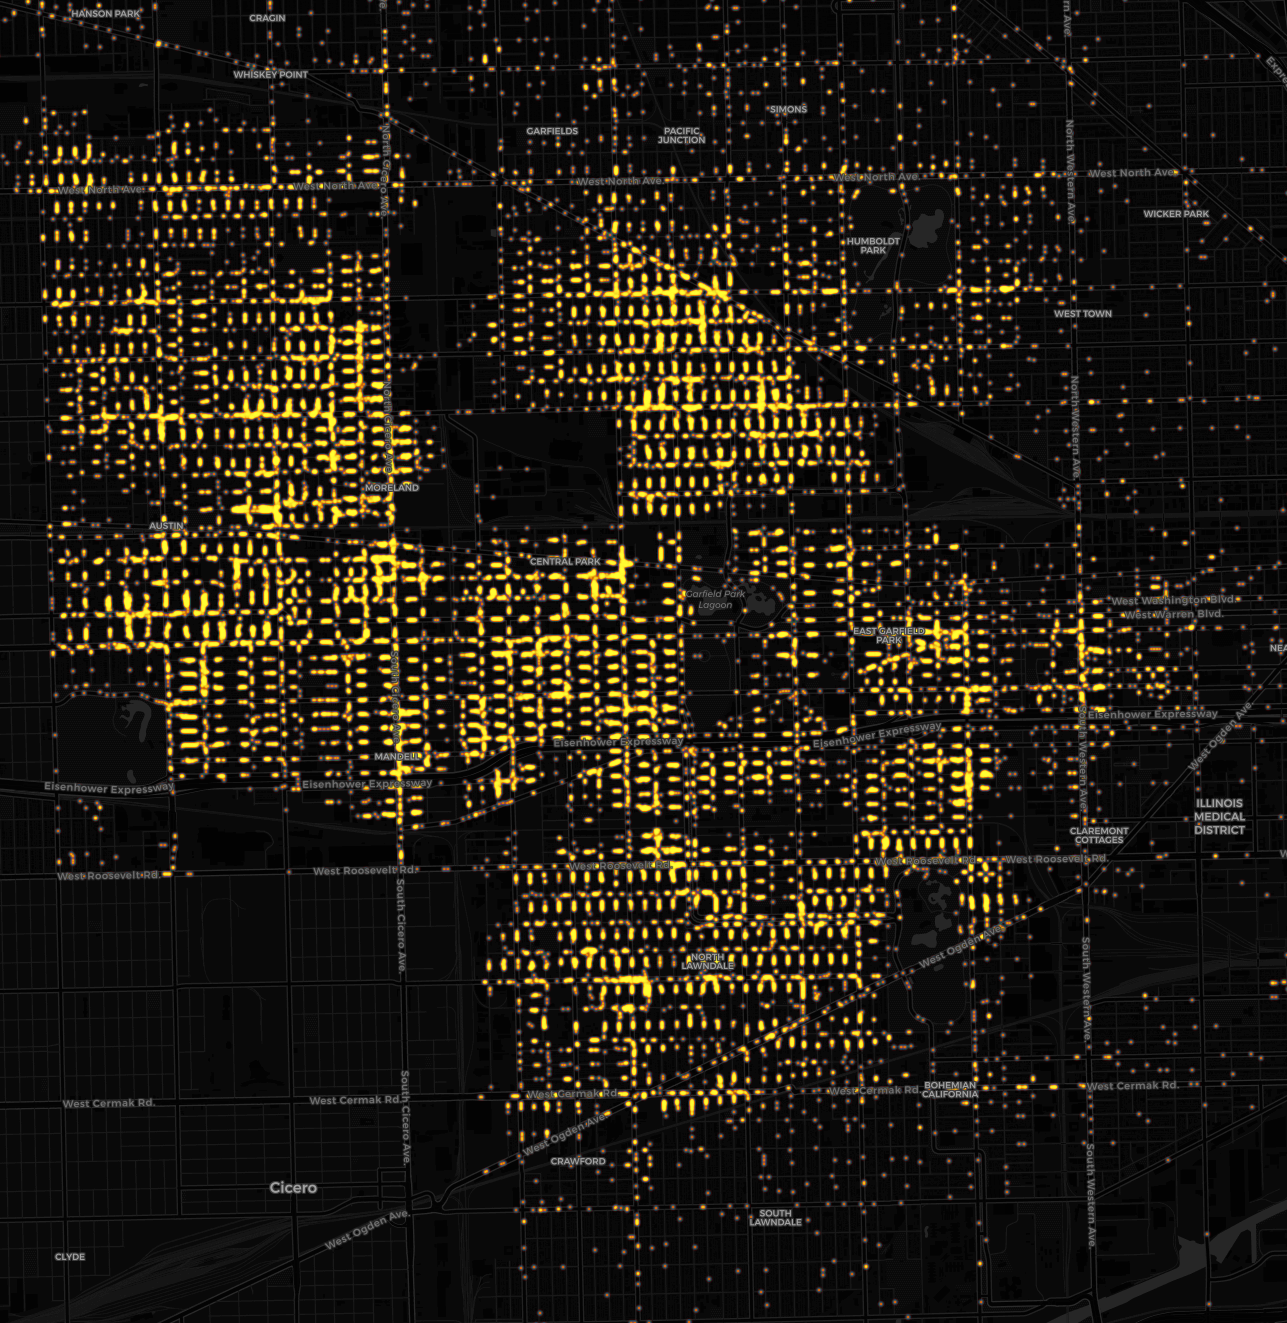
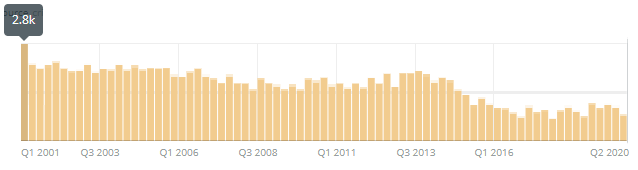
A look into heroin related arrests spanning almost 2 decades. The data is collected by the Chicago Police Department and available at Chicago Data Portal – Public Safety section. Click on static maps below to enlarge and/or play animation.
Full city map of all incidents.

West Side of Chicago. Heroin enforcement in the west side is so dense that city blocks are fully illuminated by incident reports.
South Side of Chicago (2133x2917px).

Over the last two decades CPD’s enforcement of heroin has gone down.
A look into Coronavirus data. The data set used comes from https://data.humdata.org/

Charts with and without China.


Original concept video
Domino animation created using Blender physics. Cycles was used for rendering.
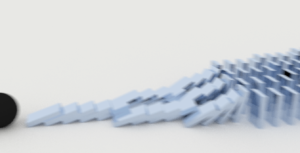
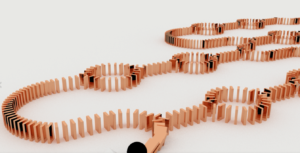
Rendered using blender 2.89
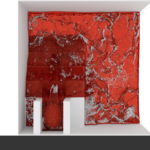
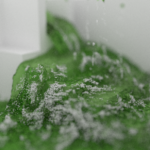
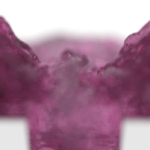
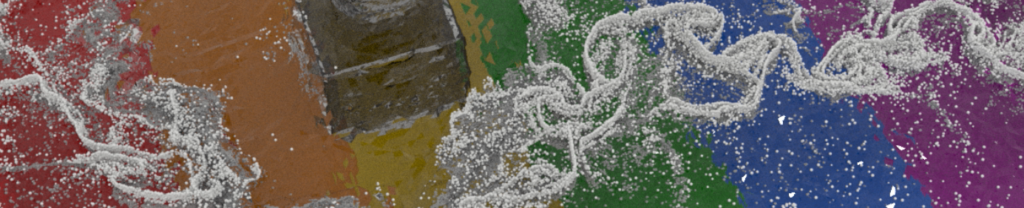
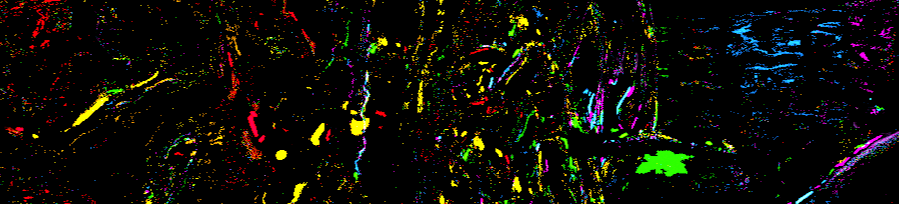
Colorful physics simulation renders.
Watch Cook County Grow over time!
Northern Triennial Townships. Residential Property Age visualized over time. Data ranges over 100 years. Data Source datacatalog.cookcountyil.gov
Assessment dataset used by the Cook County Assessor in their Computer Assisted Mass Appraisal (CAMA) system used to assess residential properties in Northern Triennial Townships.
[1821×727]

[1813×719]

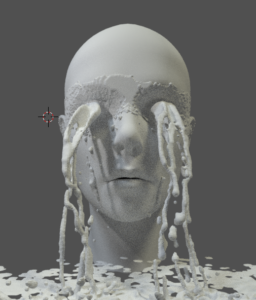
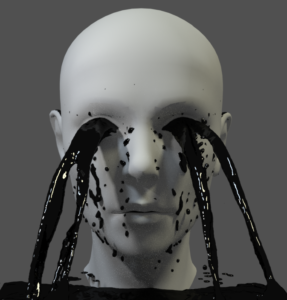
mantaflow is an open-source framework targeted at fluid simulation research in Computer Graphics. mantaflow.com.
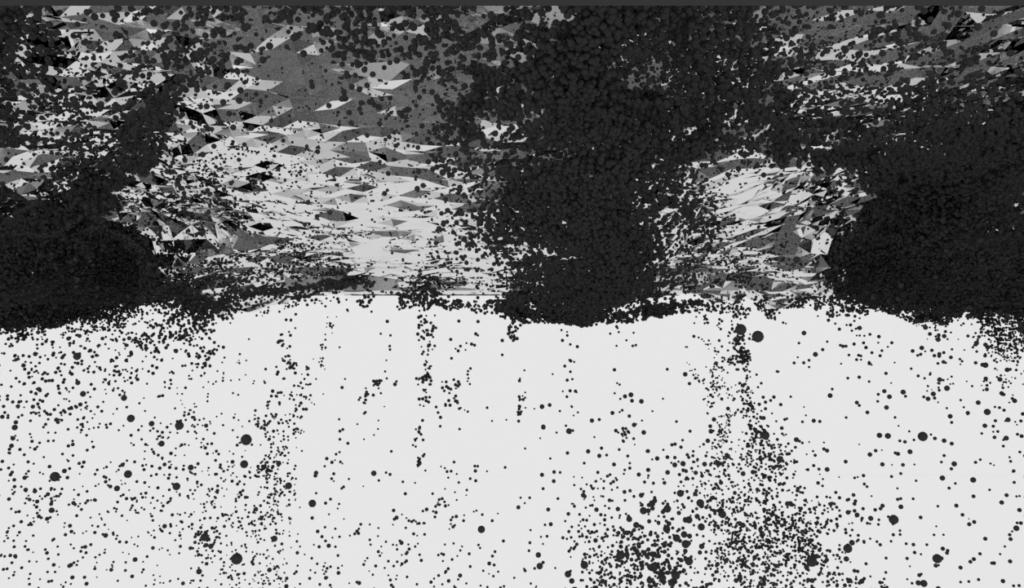
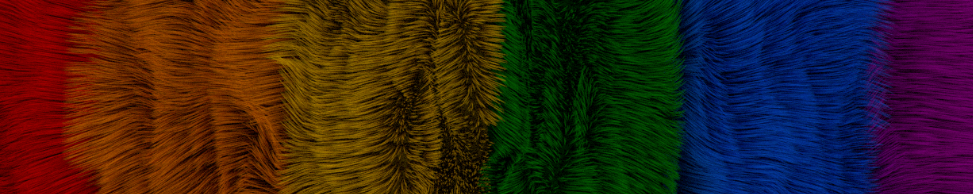
Homemade foam.