A compilation video of fluid particle physics. Animation created using blender.
Chicago Gun Commissioned Robberies Batteries and Assaults – 2010 through 2018
A visualization of gun related incident reports from the Chicago Police Department. Primary crime types of robbery, battery, and assault with the use of a handgun. Time range used 2010 through 2018. To get access to the data, visit here https://data.cityofchicago.org/
Skulls
United Kingdom Drug Maps 2015 – 2018
A look into drug enforcement in the land of Oy m8s and Jaffa Cakes. The United Kingdom.
The data is from data.police.uk The time range parsed for the street level crime of drugs was 2015 through 2018
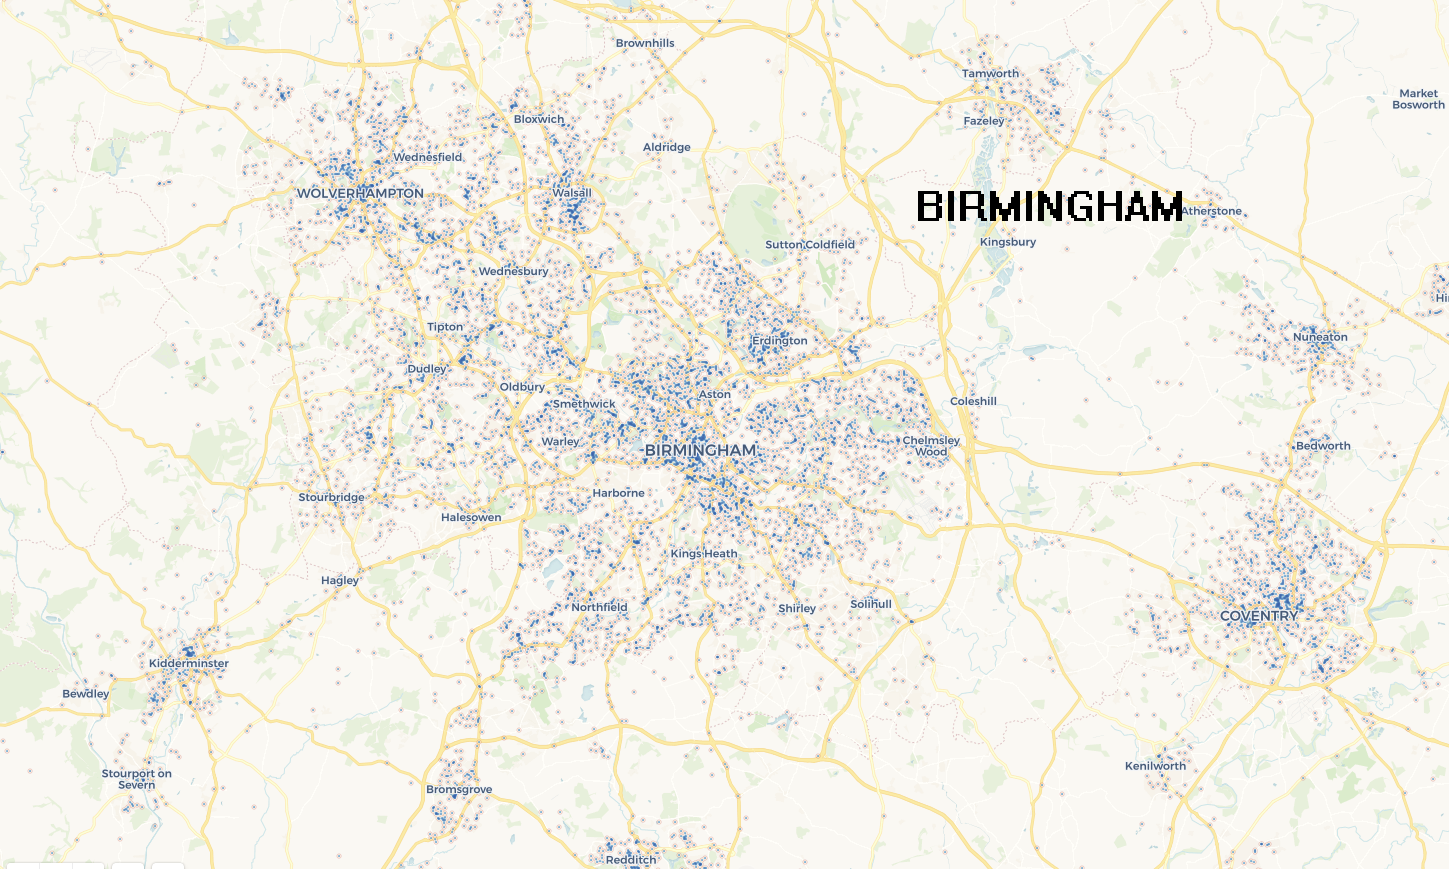
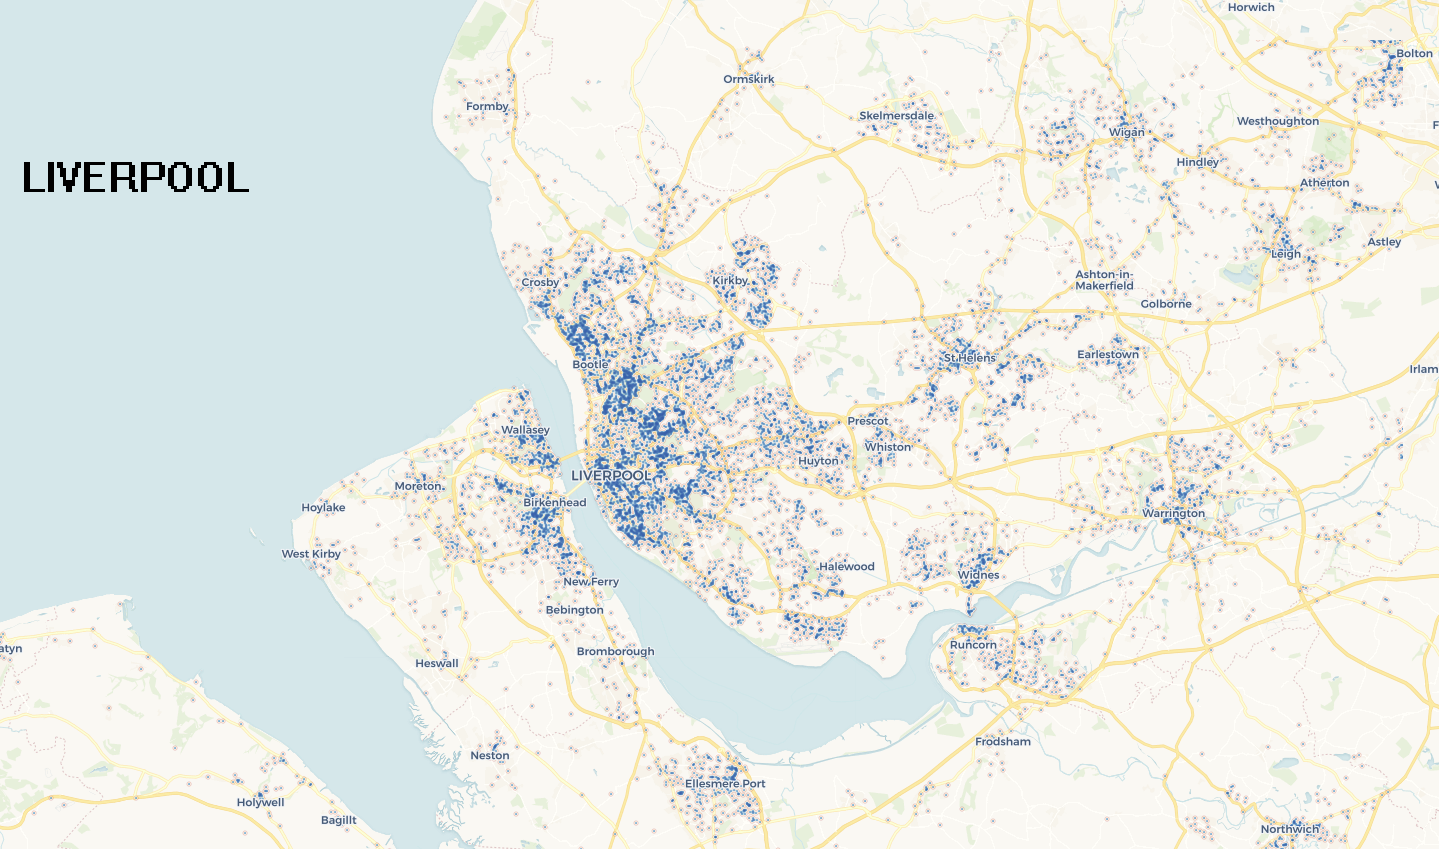
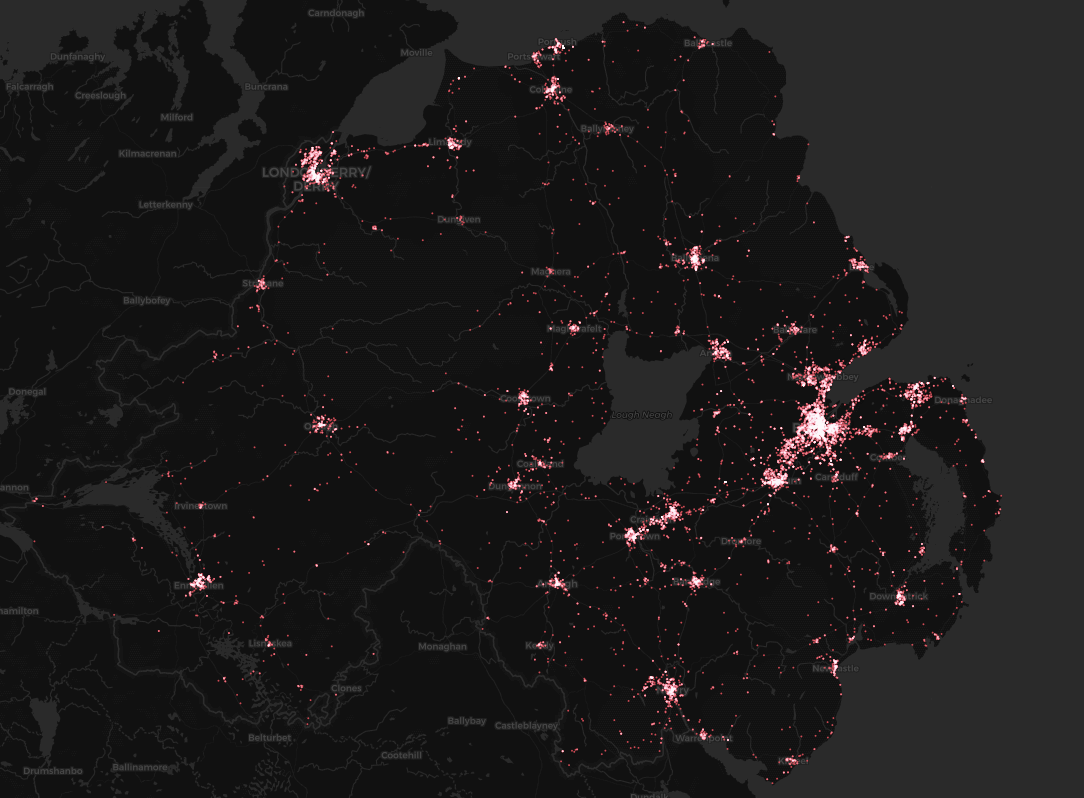
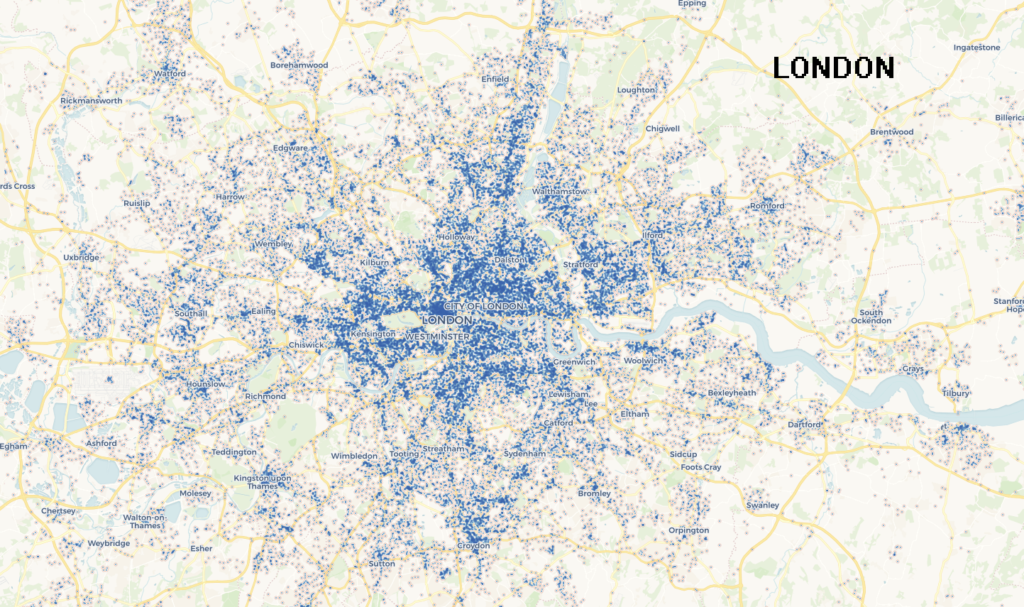
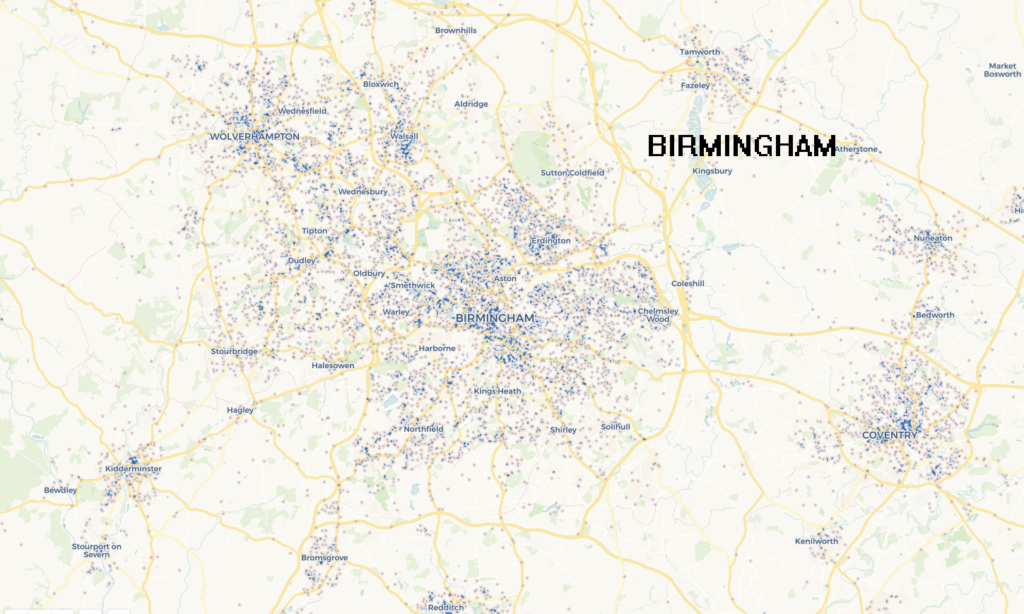
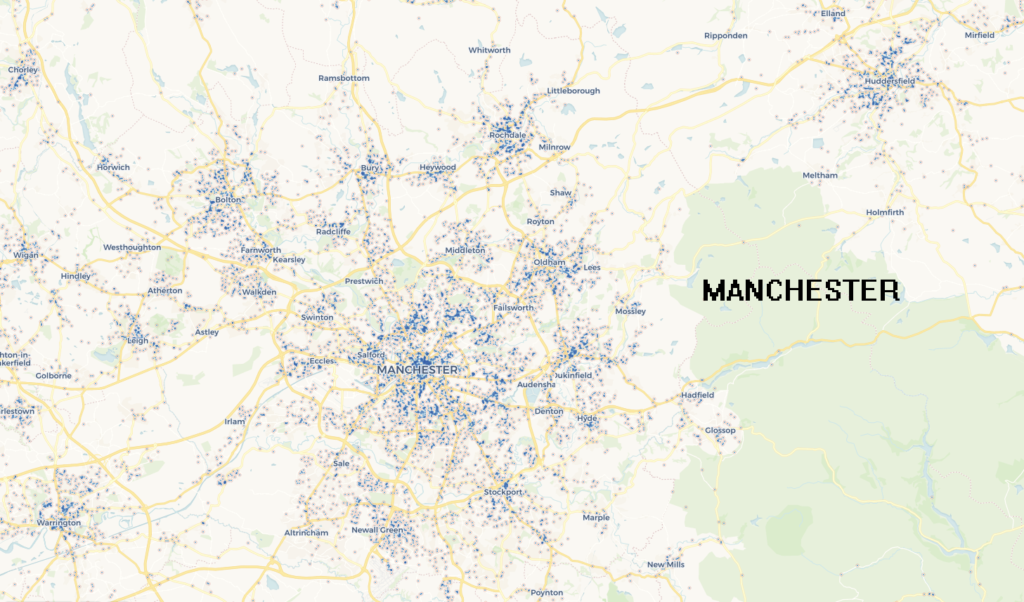
Click on maps below to enlarge
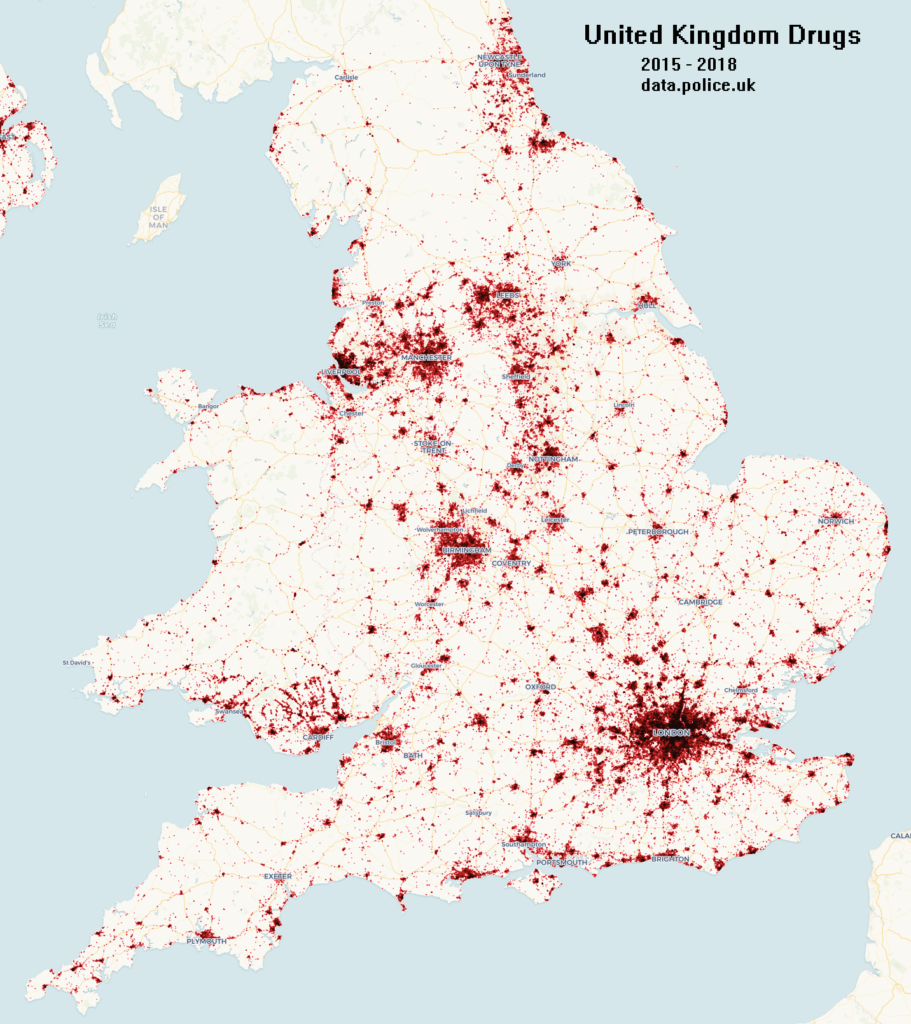
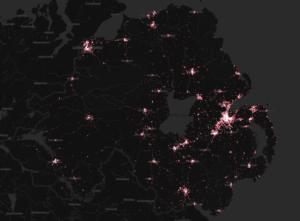
United Kingdom population density seen through the use of Illegal Drugs.
“The Government’s organised crime strategy sets out that drug trafficking to the UK costs an estimated £10.7 billion per year.”
“Class A drugs, specifically heroin, cocaine, crack cocaine and ecstasy, are widely available throughout the UK.”
“NCA seized 69.8 tonnes of cocaine, 4.5 tonnes heroin, 16.3 tonnes opium, 123.1 tonnes cannabis in their first year of operation”
“The amount of heroin estimated to be imported annually into the UK is between 18-23 tonnes. The vast majority of this is derived from Afghan opium.”
Quotes from National Crime Agency (NCA)
Old post which goes into more technical detail of how the data was parsed using c#.
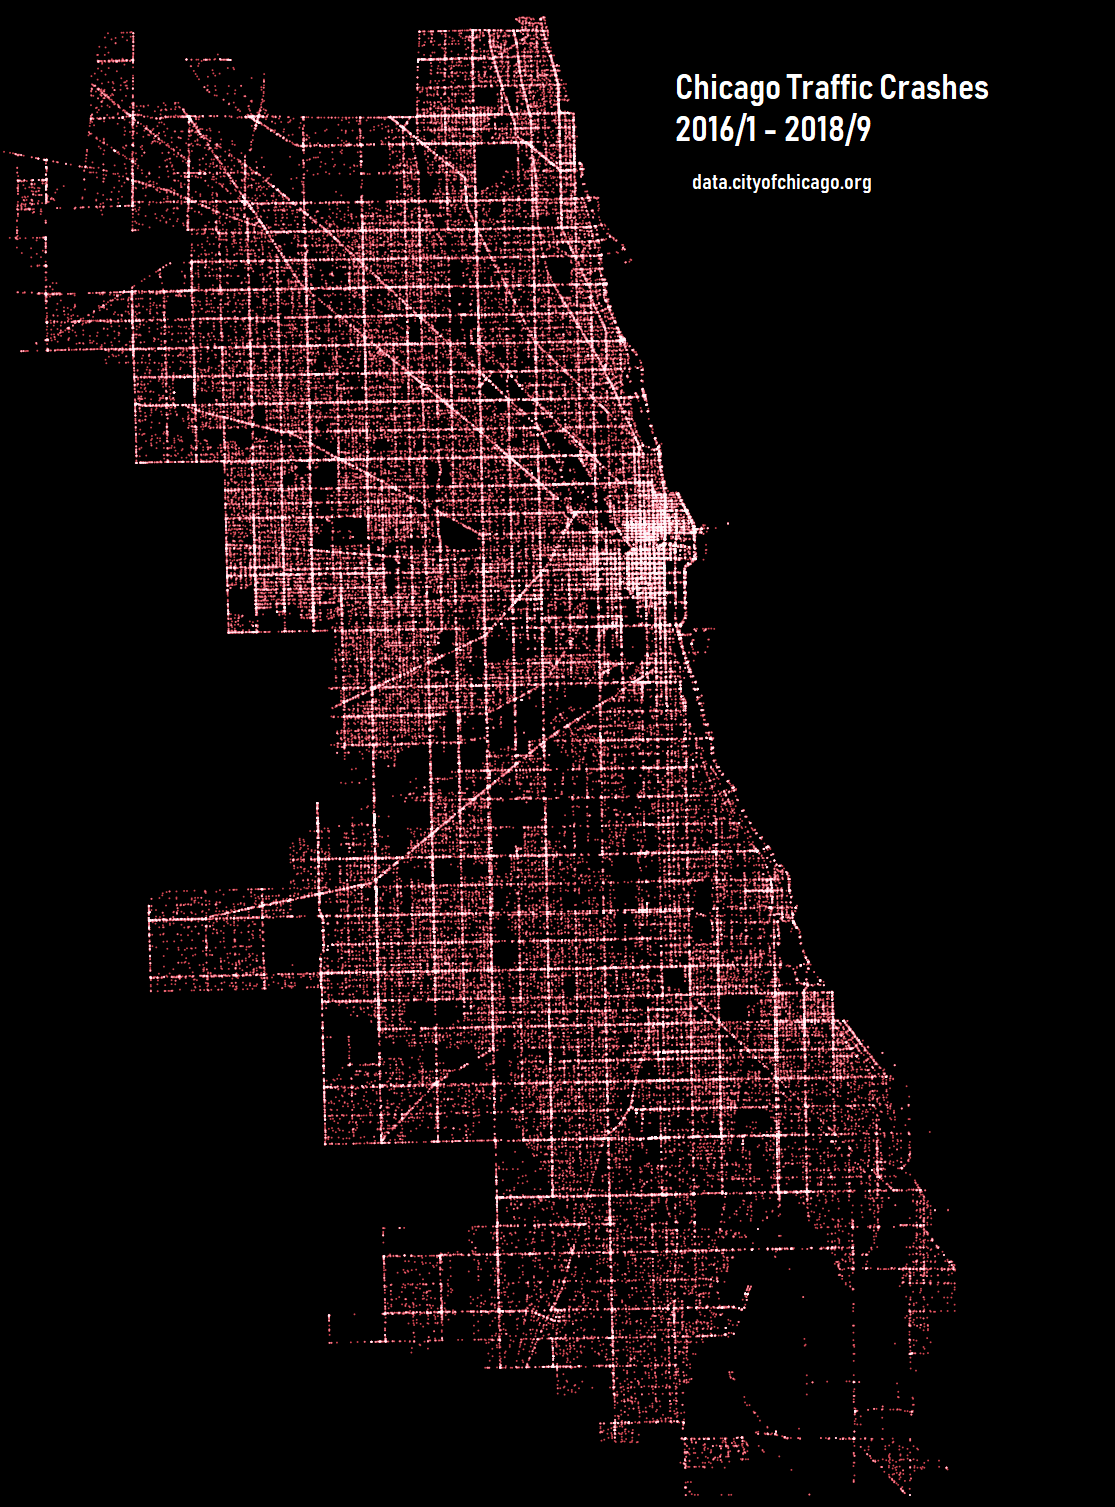
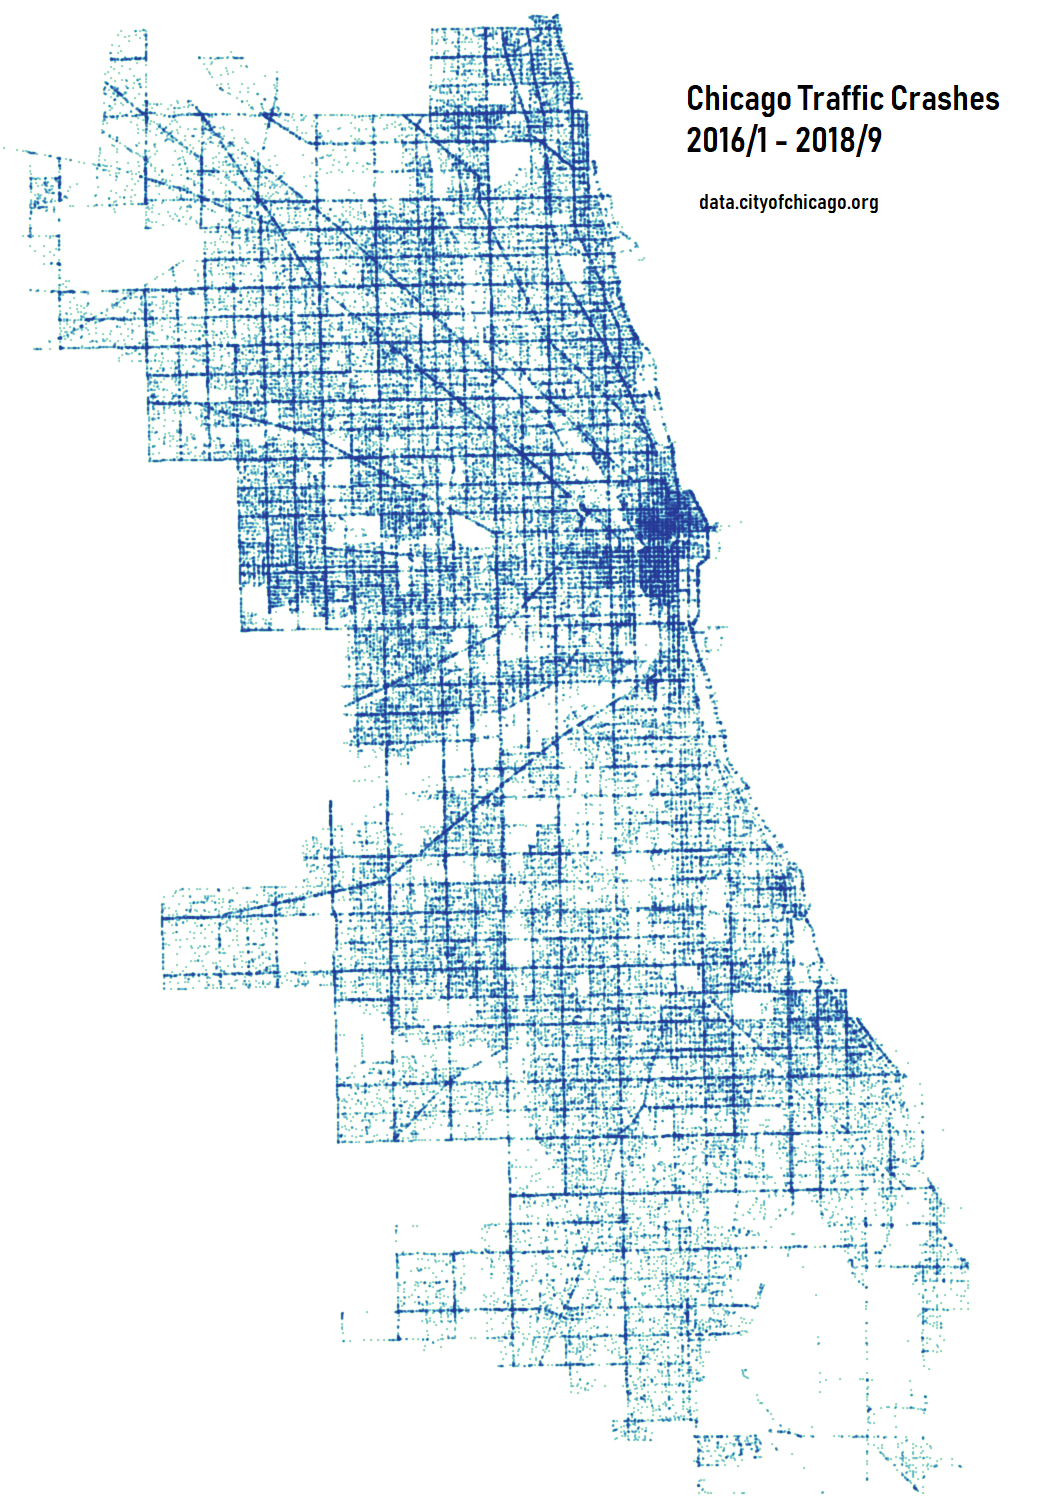
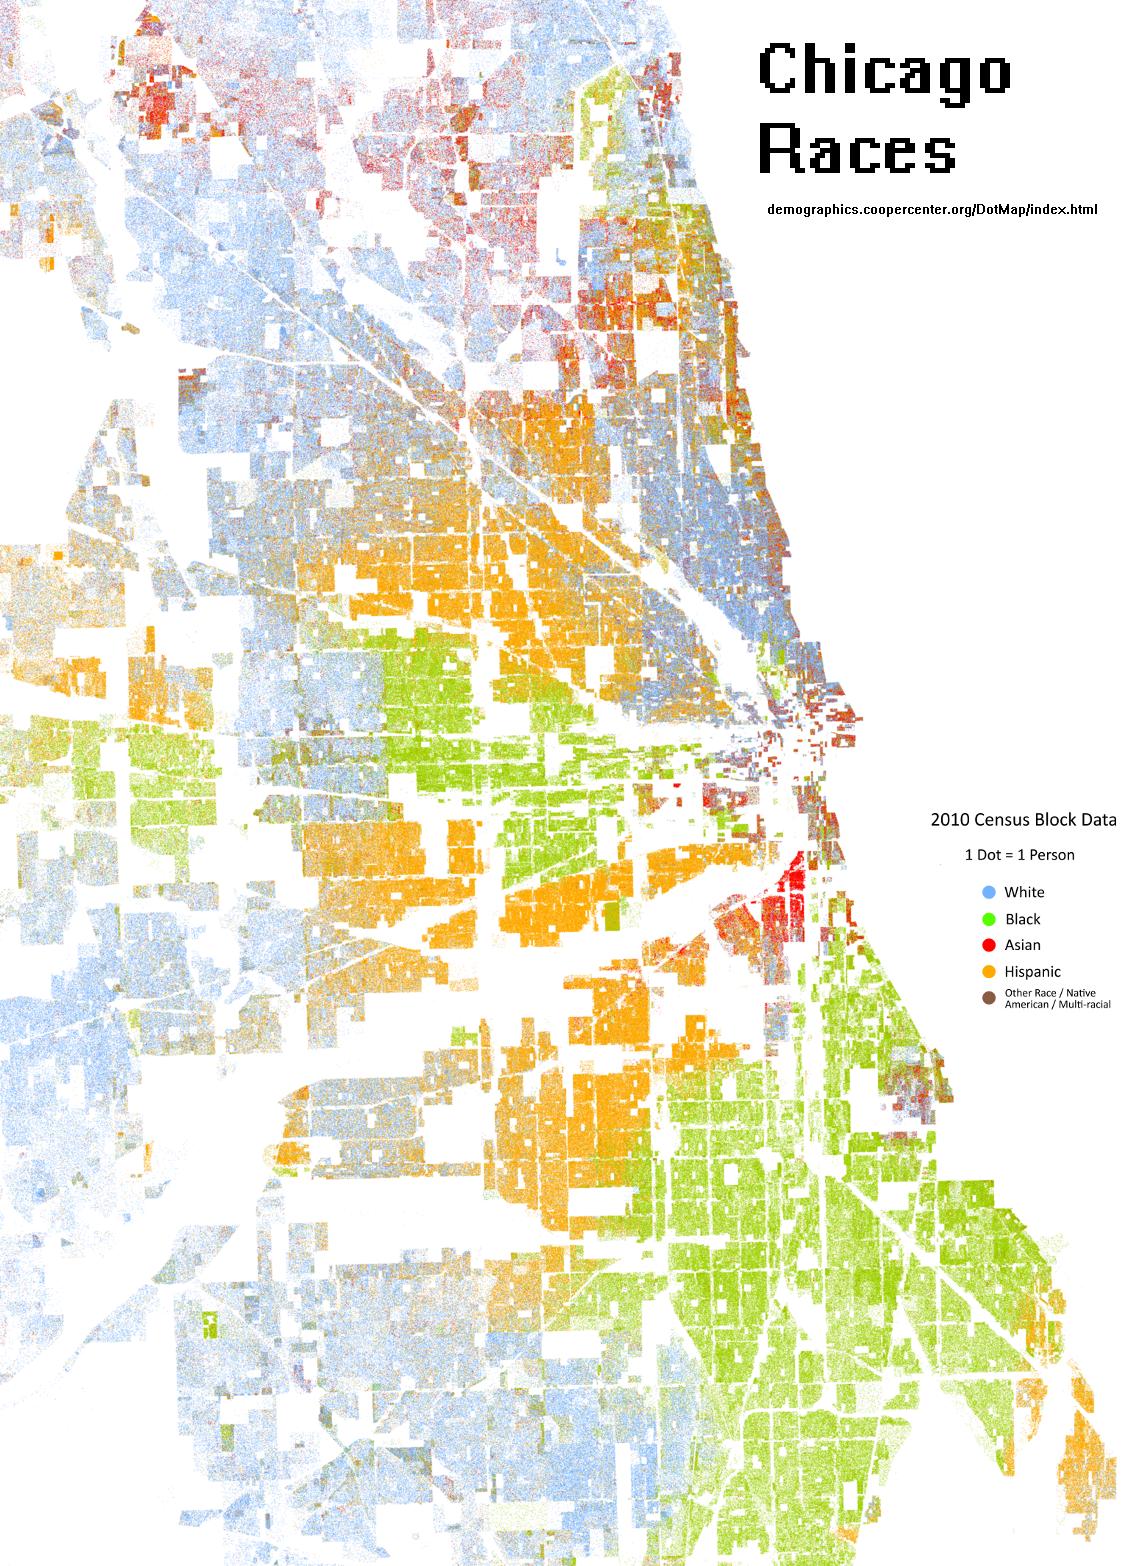
San Francisco Police Incidents for Cocaine and Heroin – Maps
A look into San Francisco Police Department’s Incident reports containing Cocaine and Heroin. Visualizations below span from 2003 through 2018. The data is from data.sfgov.org. Created using CARTO.
Creating a Geo-Temporal Map using CARTO
TUTORIAL. Want to make a Geo-Temporal map yourself? Well, you’re in luck, because I created a video tutorial for just that.
Here is an example map that you can create for free. Guess what its of.. (find out in the video below)
Tools (Websites) used:
– CARTO https://carto.com/
– Chicago Data https://data.cityofchicago.org/
Video Tutorial (youtube)
Medusa
Chicago Marijuana Maps (Incident Reports 2001 – 2018)
A look into Chicago police department’s arrest reports containing cannabis. The data is from data.cityofchicago.org. Time range used for the two static maps below is 2001 through 2018.
Time range used for bar chart and animated map below is 2010 through 2018. A gradual decline in the last 8 years can be noticed.
Chicago narcotics solicitations in public-ways; incident maps
Where will you be offered narcotics in Chicago? Or, where do cops go to do undercover busts.
Crime incident reports are gathered by the Chicago Police Department. The time range spans from 2001 through 2018. The data is from data.cityofchicago.org.
Incident descriptors used:
NARCOTICS – Primary Type
SOLICIT NARCOTICS ON PUBLICWAY – Description
A decline in publicway narcotic solicitations or enforcement can be noticed around 2008.
Denver Drugs and Alcohol Maps
A look into the Denver police department’s incident reports containing an offense category of “drug-alcohol”. The time ranged used spans from 2013 through 2018. The data is from denvergov.org.