
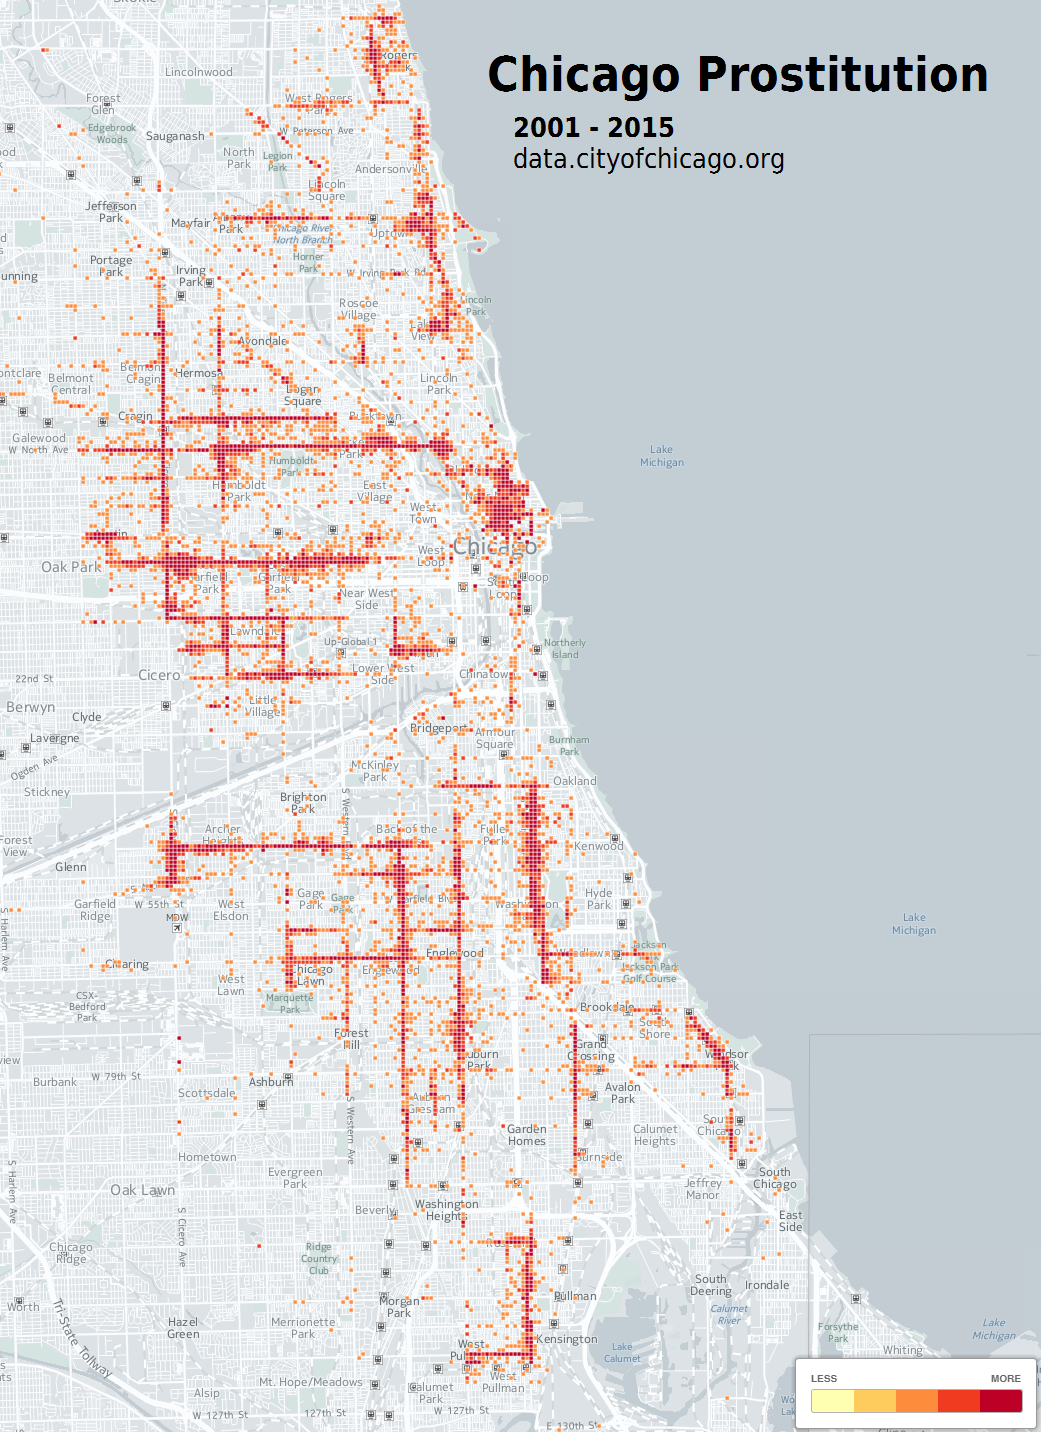
A look into 15 years worth of prostitution through the eyes of the Chicago Police Department. The data is from data.cityofchicago.org. Time range includes years 2001 through 2015. CartoDB was used to create a Density, and Torque Map.
Density map
Geo-temporal map animation, 15 years in 10 seconds.
Interesting! This would be interesting to put into an R Shiny app, so users can use a slider between the years to visualize the change over time. Let me know if you need help with this, would be glad to work with you on it.
Cool map. It’s interesting how confined it is to particular streets.
Are these prostitution arrests?