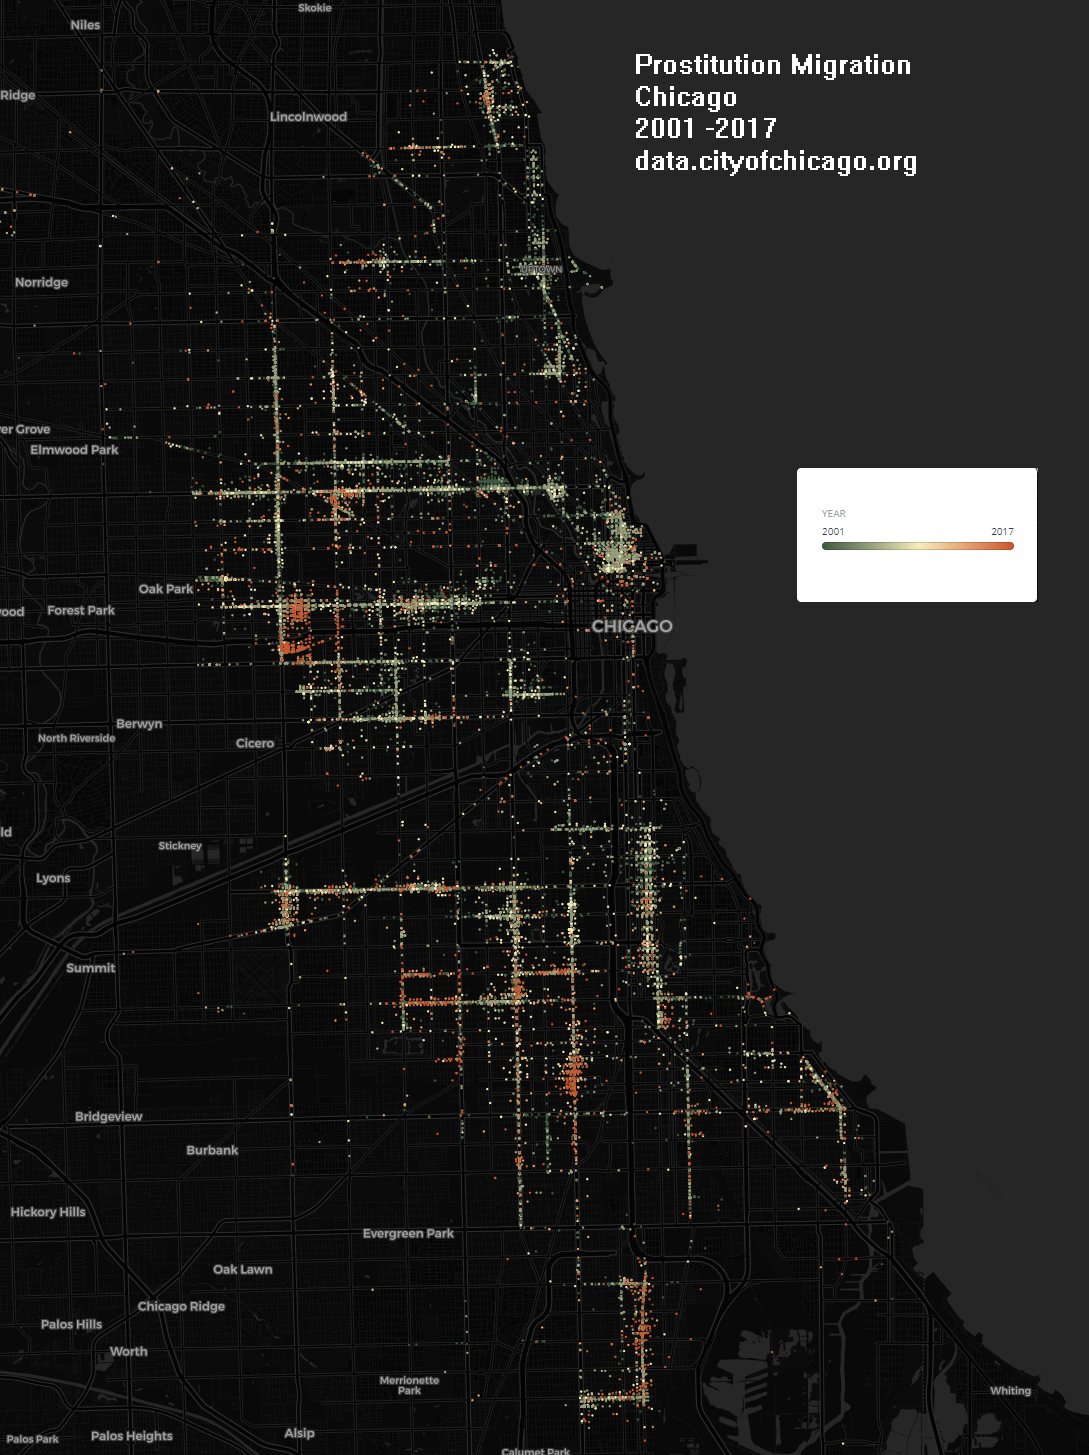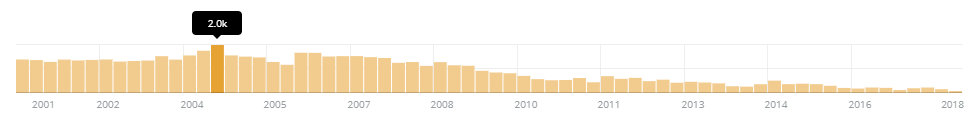
Visualizing the decline of Chicago prostitution from the eyes of the police department. The time range used spans from 2001 through 2017. The data was filtered from data.cityofchicago.org. Below is a Torque/Geo Temporal Map which animates over time using 67,690 total incident reports, each report with a primary crime type of prostitution. Beneath that is a cumulative heat map. And lastly, a map created attempting to show the migration of enforcement over years.
(click to enlarge)

(click to enlarge)