Employee Control Systems
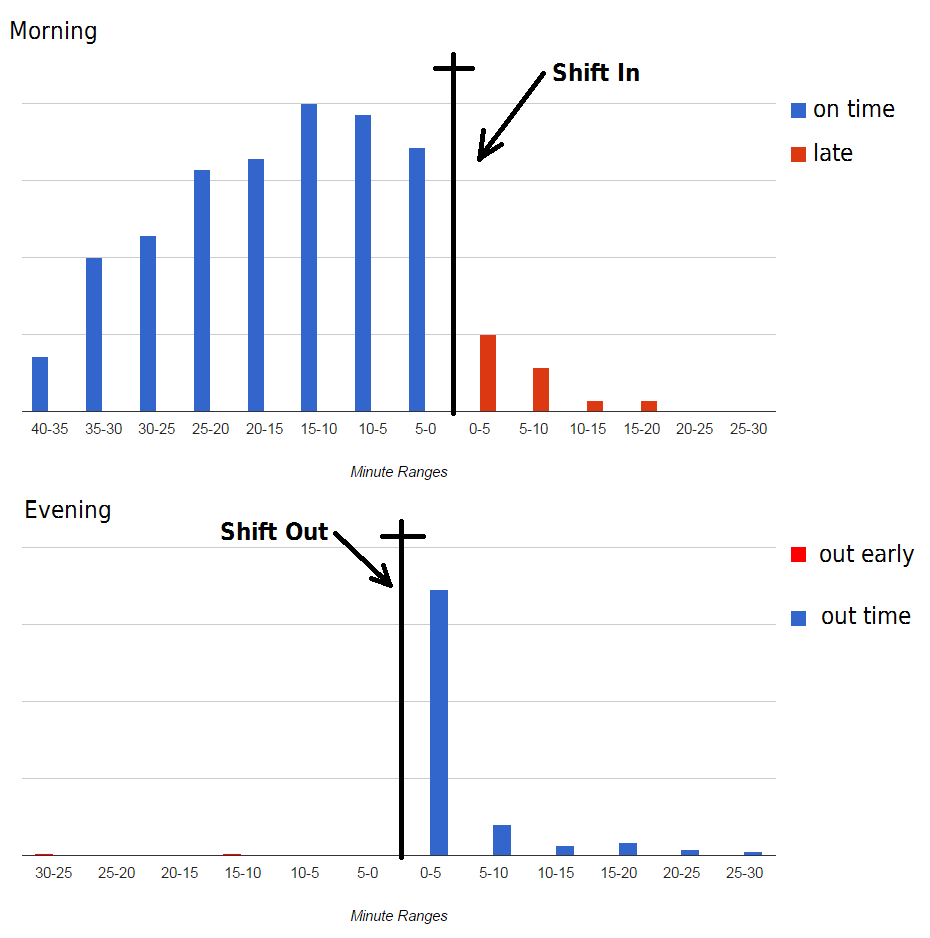

Employee Control Systems
In this post I look into Chicago Police Department’s enforcement of two particular narcotics report types: Heroin and Crack Cocaine. I was curious to see yearly migrations of CPD’s activity from 2003 to 2014 in the west side region of Chicago.

The Data is from City of Chicago Data Portal
Links to youtube video animated heatmaps (some mobile devices don’t support embedded videos on my site):
http://www.youtube.com/watch?v=2qGPhlBGWxQ
http://www.youtube.com/watch?v=uh22pGBLgYo
http://www.youtube.com/watch?v=czoofaWOAps
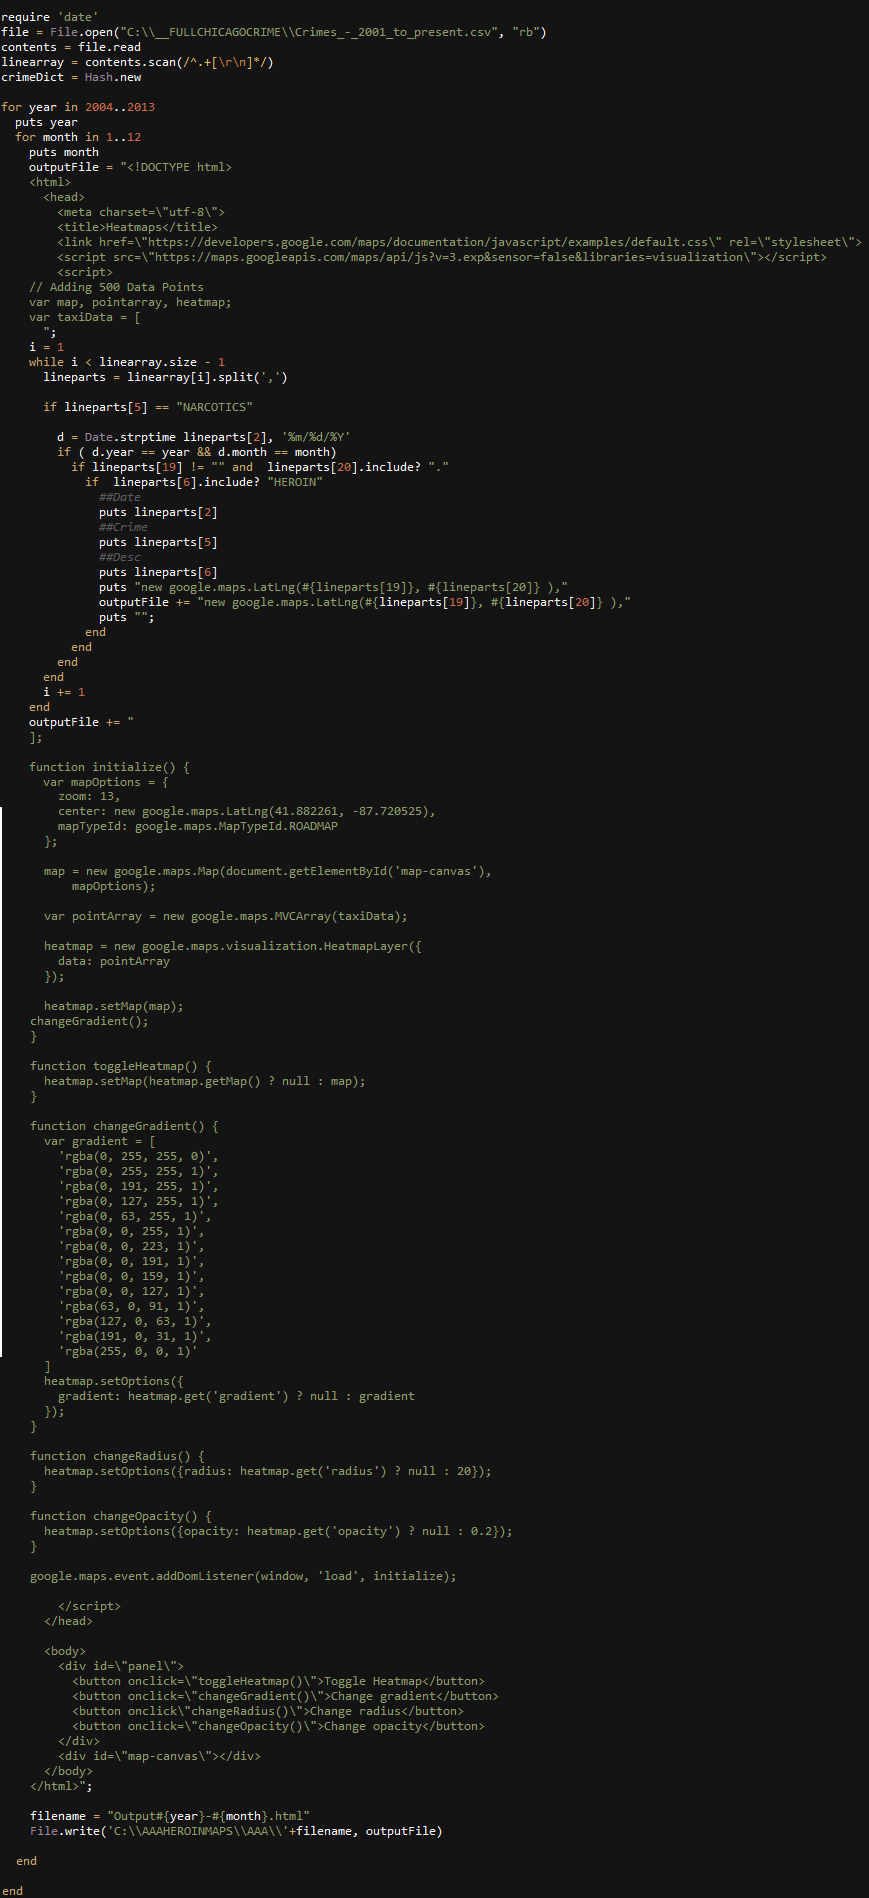
Ruby was used to parse the data and convert into JSON.
Google Heatmaps API was used to generate the maps.
Camtasia Studio 8 was used to annotate and export the videos.
Ruby written to create monthly maps
The data was found on github here:
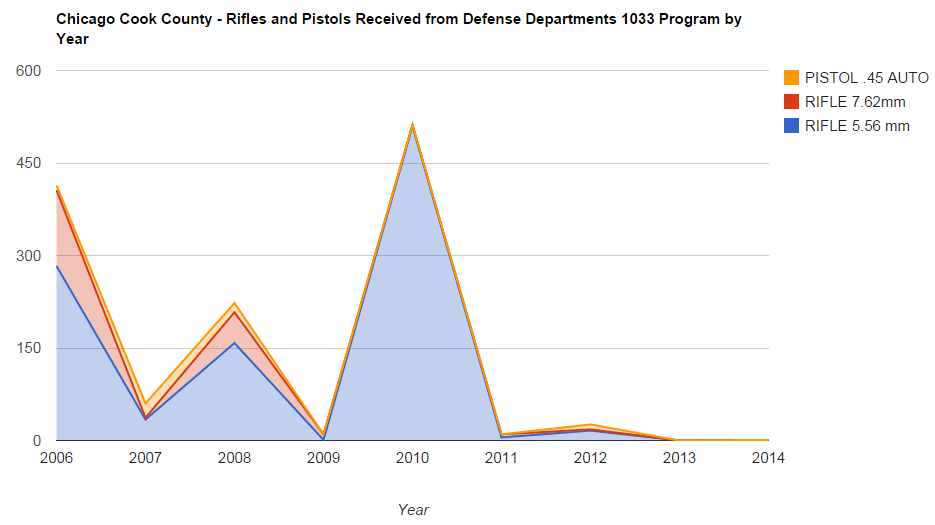
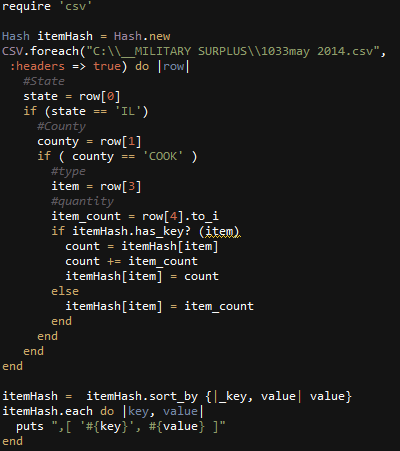
Military Surplus Gear
The charts below cover Chicago, IL, Cook County

This chart displays Rifles and Pistols received by year.
This graph shows most popular equipment items received from 2006 through May 2014.
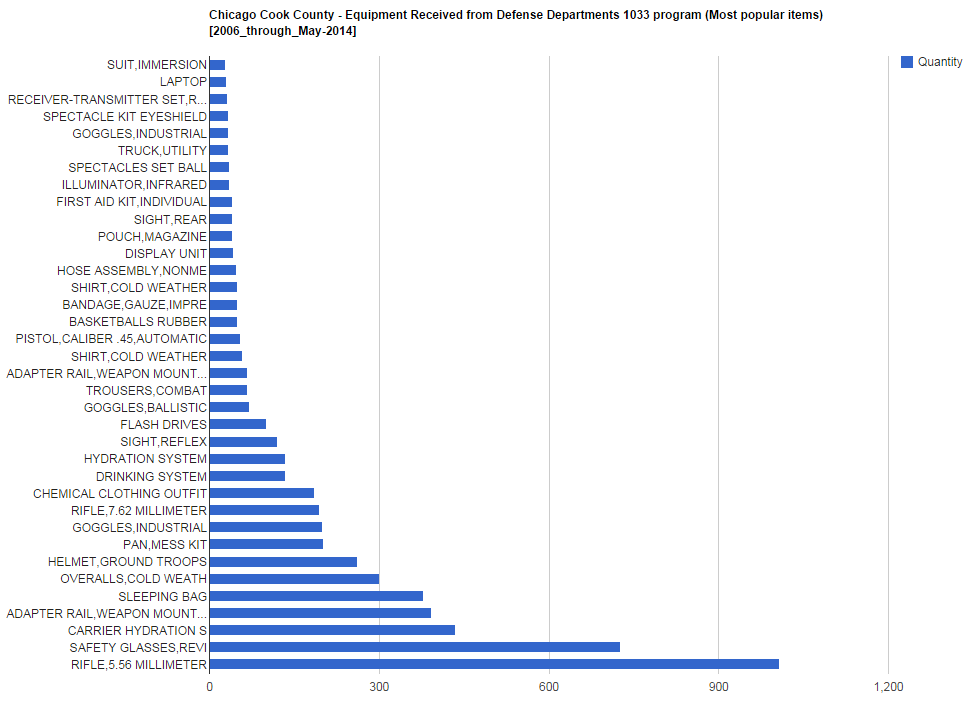
Ruby code used to parse and format the data. Google charts was used to display it.
According to this data : Current Employee Names, Salaries, and Position Titles on City Of Chicago Data Portal https://data.cityofchicago.org/;
The Chicago government employees 32,160 employees, and pays approximately $2,429,980,941.36 in annual salaries.
Google Charts API was used.
CLICK ON Pictures FOR Focus. (temporary courtesy of imgur)
All Employees.

Let’s remove distinct Position-Titles with Less Then 10 Employees, and the position title of Police Officer from the data.

(20 or more), and, (200 or less); employee counts within a position title.

(10 or more), and,( 50 or less); employee counts within a position title.

C#
int counter = 0; string line; Dictionary<string, int> dCount = new Dictionary<string, int>(); Dictionary<string, decimal> dSalTotal = new Dictionary<string, decimal>(); Dictionary<string, LinkedList> dDeps = new Dictionary<string, LinkedList>(); System.IO.StreamReader file = new System.IO.StreamReader("C:\\AAAChicagoEmployees\\Current_Employee_Names__Salaries__and_Position_Titles (1).csv"); while ((line = file.ReadLine()) != null) { string[] parts = line.Split(','); try { string name = parts[2]; name = Regex.Replace(name, "'", ""); string dep = parts[3]; decimal sal = decimal.Parse(parts[4].TrimStart('$') ); if ( dCount.ContainsKey(name ) ) { int a = dCount[name]; a += 1; dCount[name] = a; decimal b = dSalTotal[name]; b += sal; dSalTotal[name] = b; LinkedList c = dDeps[name]; c.AddLast(dep); dDeps[name] = c; } else { dCount.Add(name, 1); dSalTotal.Add(name, sal); LinkedList newDepList = new LinkedList(); newDepList.AddLast(dep); dDeps.Add(name, newDepList); } } catch (Exception x) { //header line } counter++; } file.Close(); Dictionary<string, decimal> dAveOrder = new Dictionary<string, decimal>(); foreach (KeyValuePair<string, int> item in dCount.OrderBy(key => key.Value)) { if (item.Value >= 10 && item.Value <= 50) { decimal aveSal = dSalTotal[item.Key] / item.Value; dAveOrder.Add(item.Key, aveSal); } } string json = ""; foreach (KeyValuePair<string, decimal> item in dAveOrder.OrderBy(key => key.Value)) { Hashtable frequencyHash = new Hashtable(); LinkedList uniqueList = new LinkedList(); foreach (var element in dDeps[item.Key]) { if (uniqueList.Contains(element)) { int elementCount = int.Parse(frequencyHash[element].ToString()); elementCount++; frequencyHash[element] = elementCount; } else { uniqueList.AddLast(element); frequencyHash.Add(element, 1); } } int max = 0; string sMaxDep = ""; foreach (string element in frequencyHash.Keys) { int iDep = int.Parse(frequencyHash[element].ToString()); if (iDep > max) { max = iDep; sMaxDep = element; } } if (item.Key == "POLICE OFFICER") { } else { json += "[ '" + item.Key + "', " + dCount[item.Key] + " , " + item.Value + " ,'" + Regex.Replace(sMaxDep, "'", "") + "' , " + item.Value + " ],\r\n"; } } System.IO.StreamWriter fileWrite = new System.IO.StreamWriter("c:\\AAAChicagoEmployees\\data.txt"); fileWrite.WriteLine(json); fileWrite.Close(); |
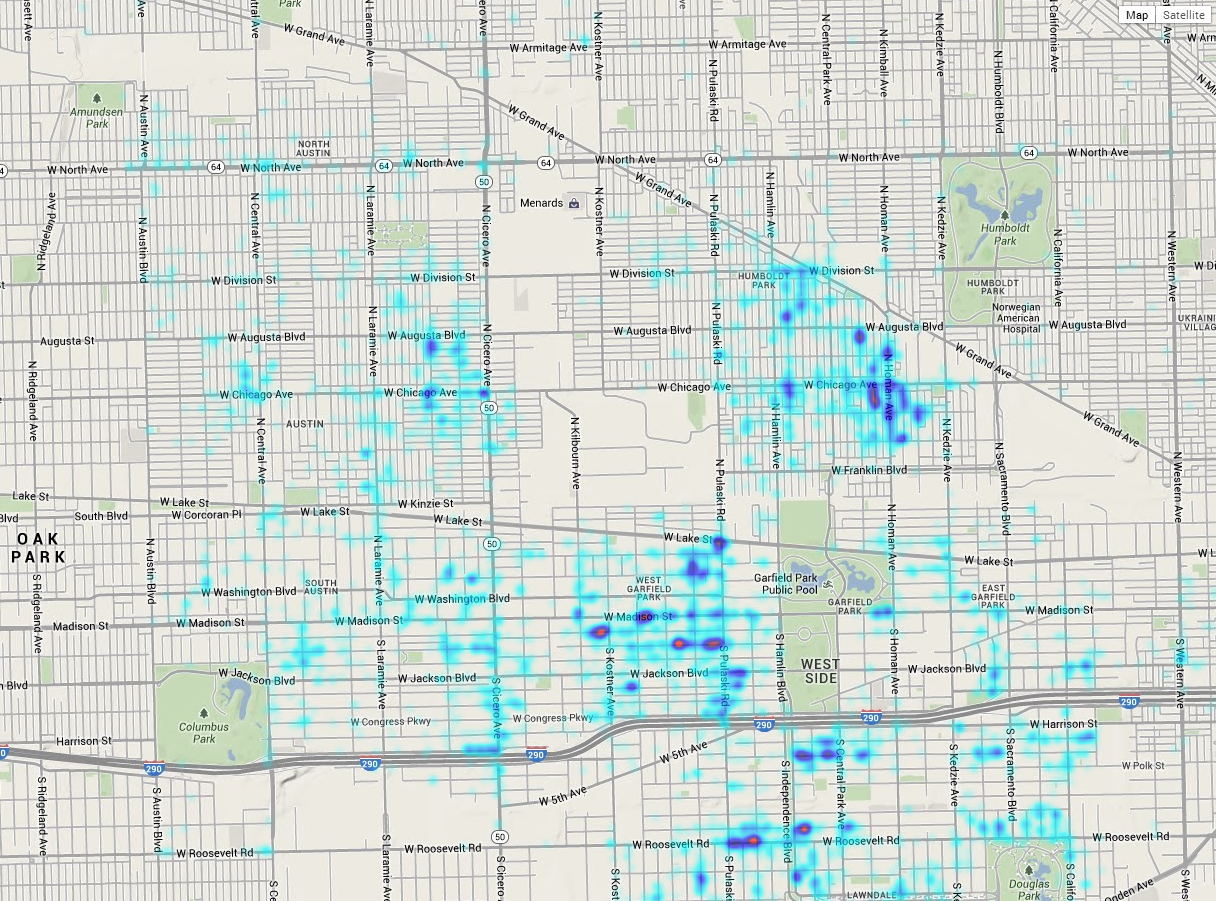
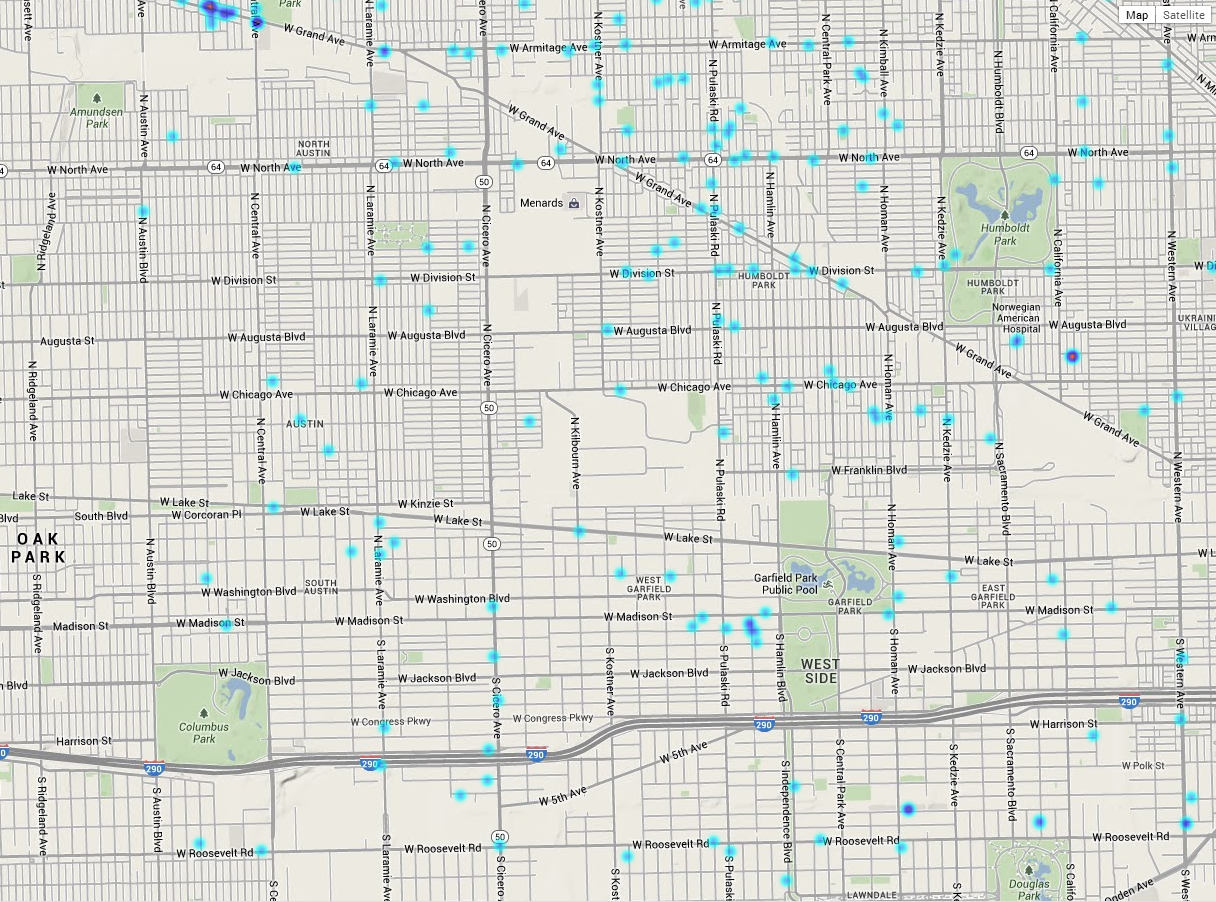
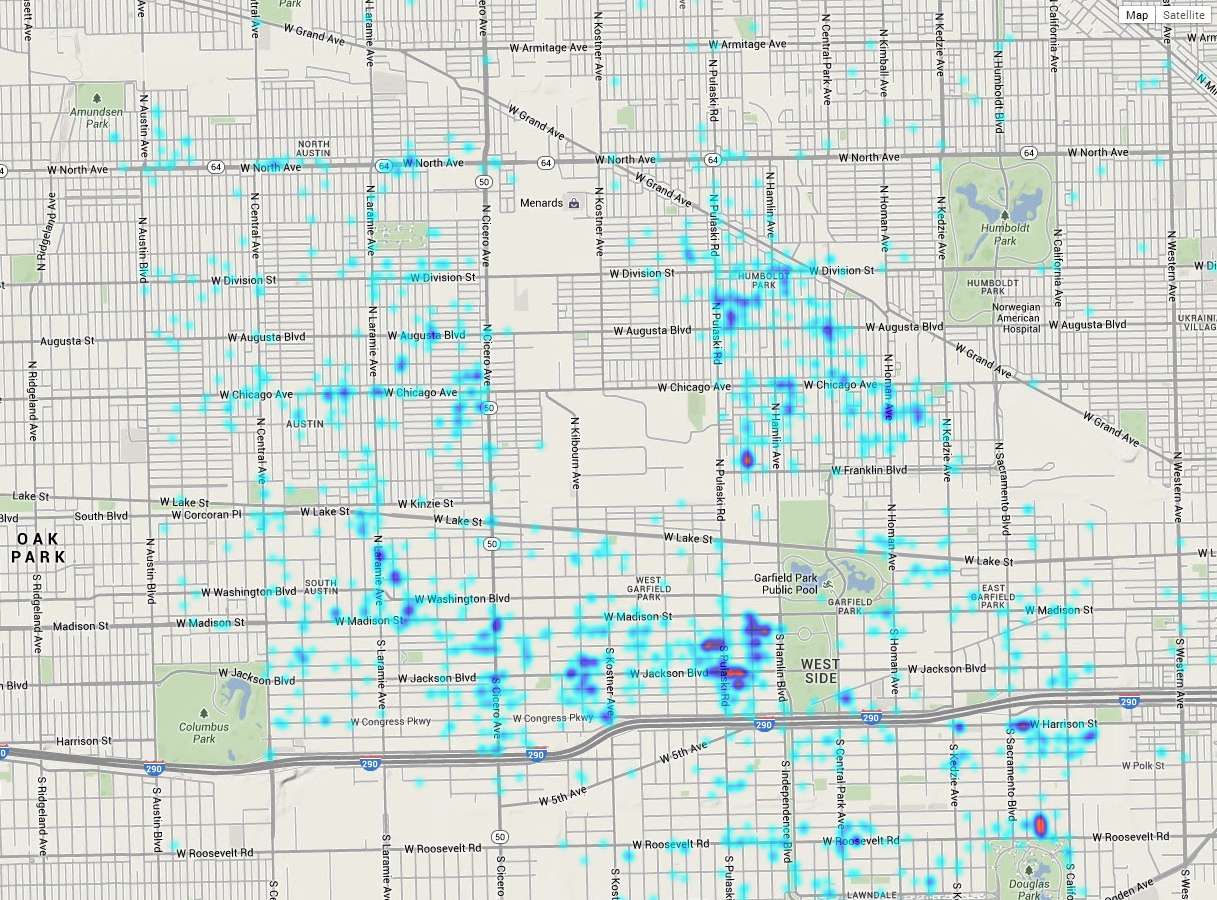
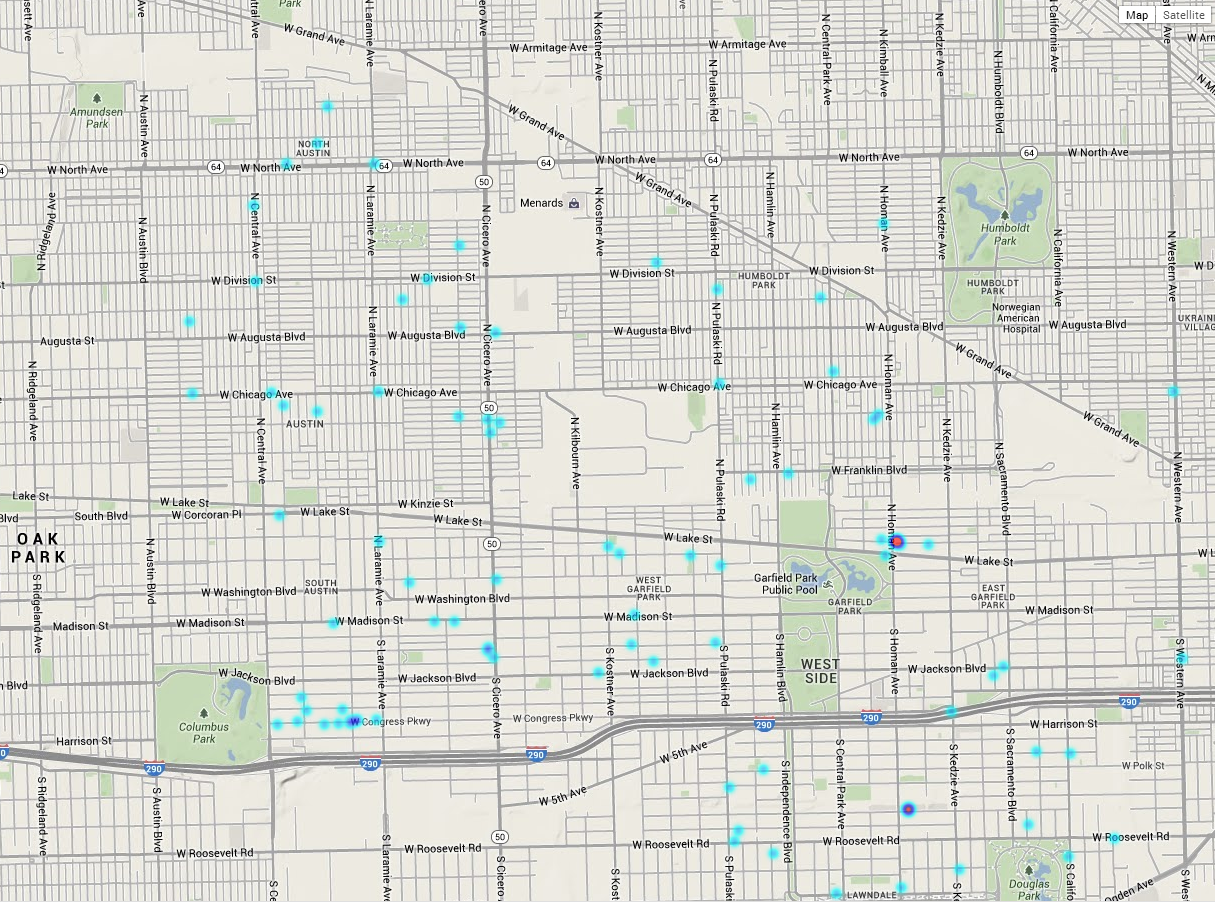
A look into the West Side of Chicago’s Narcotics related Arrests.
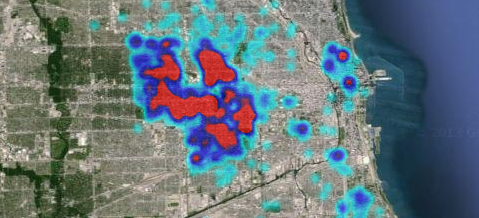
The data is from City of Chicago Data Portal. Time Range used from 1-1-13 through 5-8-14. Data was exported and saved as CSV. Ruby code was written to parse out and format the coordinates. Google Heatmaps Javascript API v3 was used to generate the heatmaps.
Heroin
POSS: HEROIN(WHITE), MANU/DELIVER: HEROIN (WHITE), POSS: HEROIN(BRN/TAN), POSS: HEROIN(BLACK TAR), MANU/DELIVER: HEROIN(BRN/TAN), MANU/DELIVER:HEROIN(BLACK TAR)
Cocaine
POSS: COCAINE, MANU/DELIVER:COCAINE
Crack
MANU/DELIVER:CRACK, POSS: CRACK
PCP
POSS: PCP, MANU/DELIVER:PCP

Marijuana
POSSESSION: SYNTHETIC MARIJUANA, MANU/POSS. W/INTENT TO DELIVER: SYNTHETIC MARIJUANA, POSS: CANNABIS 30GMS OR LESS, MANU/DEL:CANNABIS OVER 10 GMS, POSS: CANNABIS MORE THAN 30GMS, MANU/DEL:CANNABIS 10GM OR LESS, DELIVER CANNABIS TO PERSON <18, CANNABIS PLANT, ATTEMPT POSSESSION CANNABIS

Hallucinogen
POSS: HALLUCINOGENS, MANU/DELIVER: HALLUCINOGEN
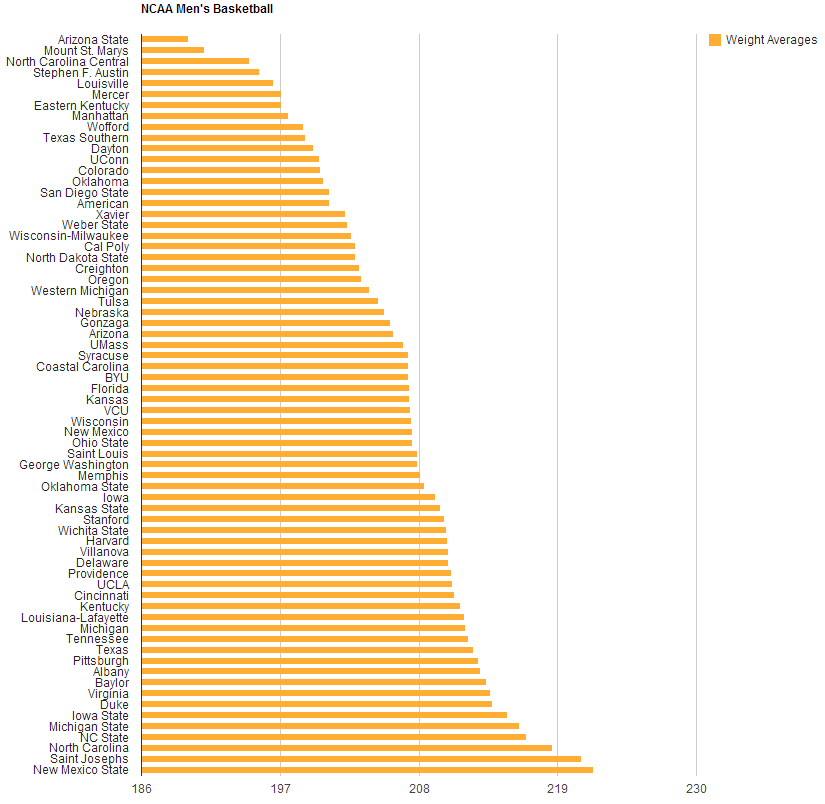
Fun with random data. Find, investigate, and plot.
I parse an NFL dataset, and visualize it in a GoogleCharts Column Chart.
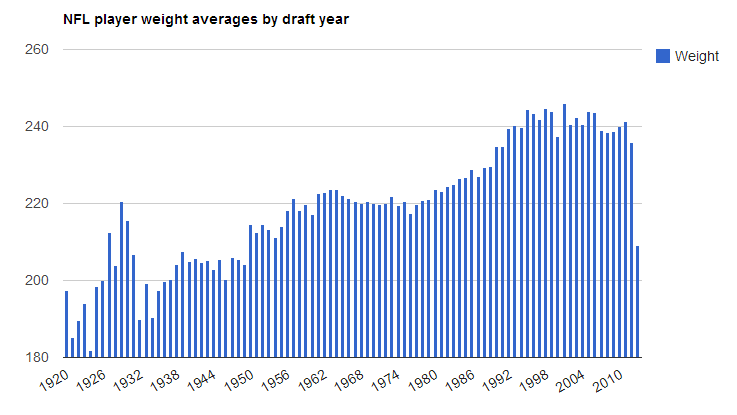
The video above details the steps taken
Ruby:
Google Charts html formatting:
Ruby:
The data is from Here.

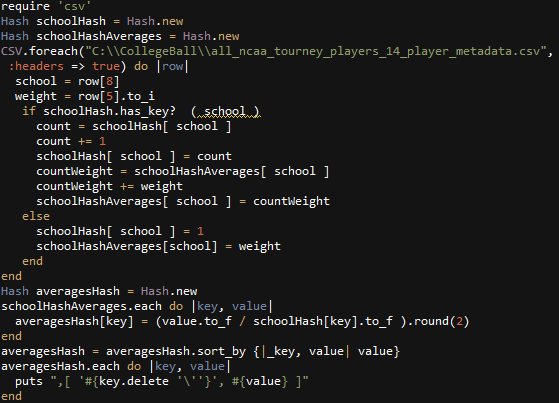
Weight Averages (lb) by School
Height Averages (inches) by School

Ruby used to parse data.
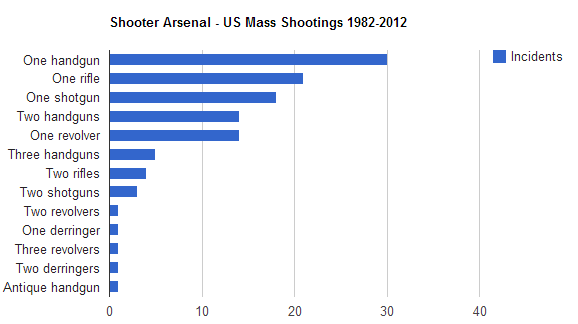
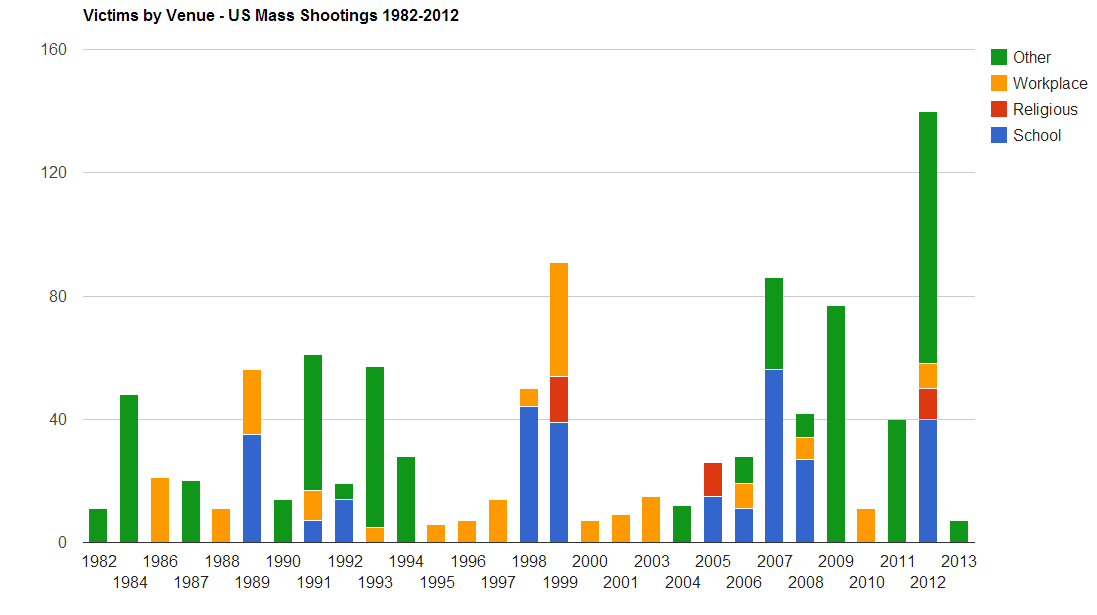
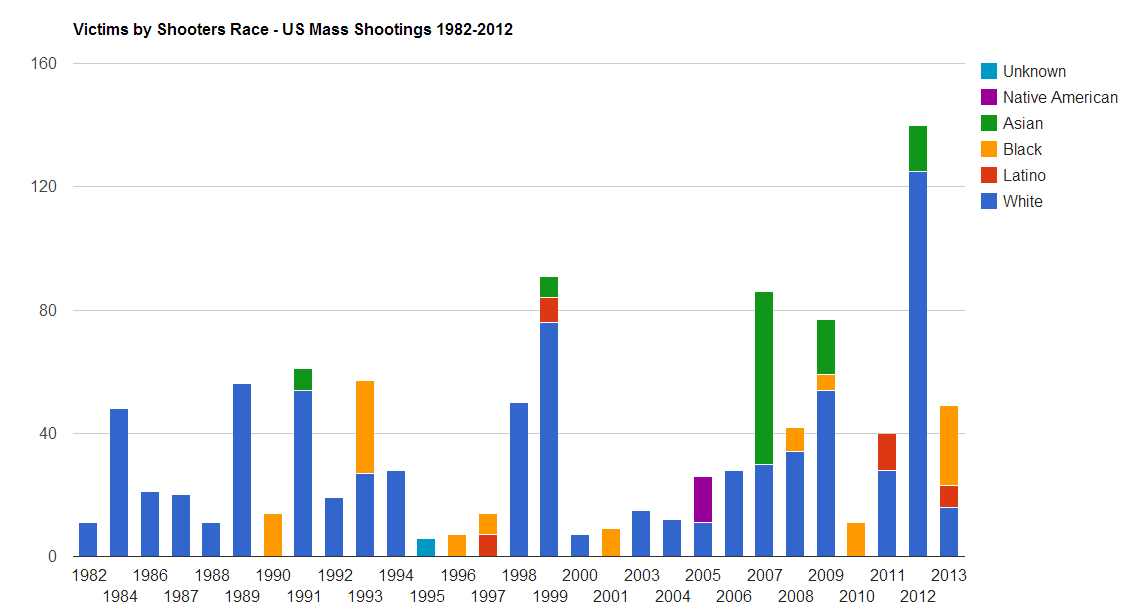
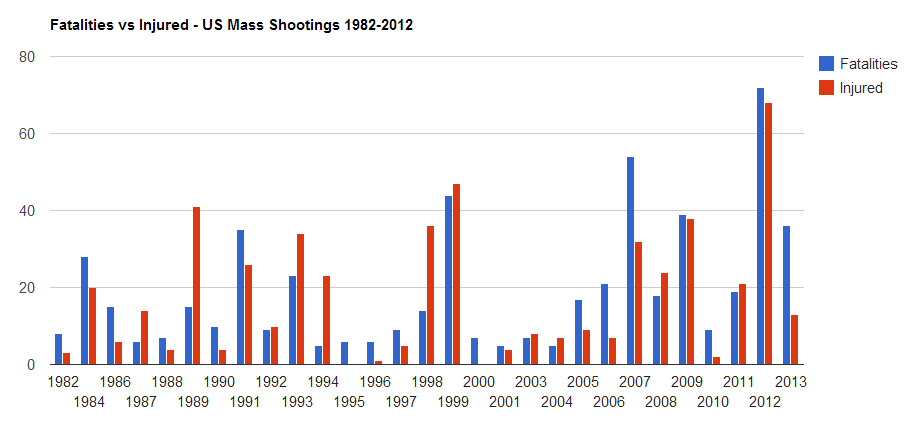
United States Mass Shootings. Data is from Mother Jones

Shooter Arsenal
Victims by Venue
Victims by Race
Fatalities vs Injured
Gender

Another Animated heat map of Chicago’s crimes.
Via : Data Portal: City of Chicago
Monthly Heatmaps of Chicago Police Department’s Narcotics, Assault, and Battery Reports. 2008 – 2013
In this post, I will give a semi-detailed overview of how to make an animated heat map over a time range. This is my first attempt at making an animated heat map.
I will be revisiting Chicago crime statistics from City of Chicago Data Portal 2001-2013
This dataset reflects reported incidents of crime (with the exception of murders where data exists for each victim) that occurred in the City of Chicago from 2001 to present, minus the most recent seven days.Data is extracted from the Chicago Police Department’s CLEAR (Citizen Law Enforcement Analysis and Reporting) system. Read More about the dataset here
On 11/28/2013 I downloaded a csv from chicago’s data portal named Crimes_-_2001_to_present.csv, its size was 1,050,688 KB
Here is an example of how I would parse out all coordinates of narcotics violations for the month of January in 2013.
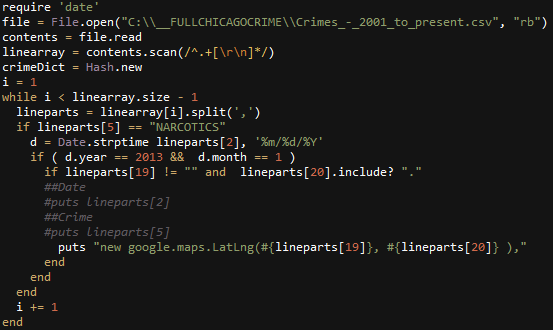
Lets test the coordinate outputs by appending them into a google maps heatmap.
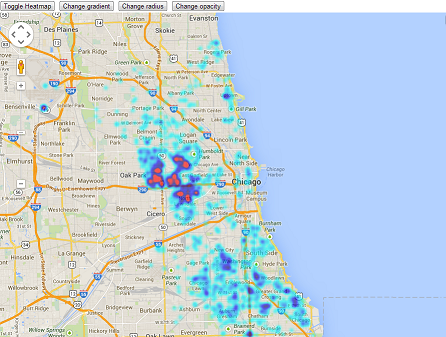
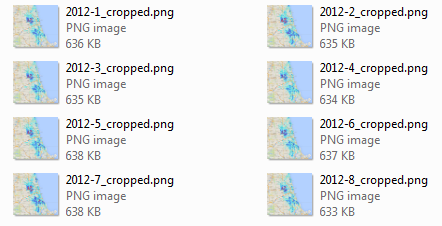
Okay, now I’m going to manually make one of these images (with static center and size) for each month from January 2012 to October 2013. Next, I wrote a quick c# application using ImageMagick to programmatically crop each Browser screenshot.
string[] files = Directory.GetFiles(@"c:\__FULLCHICAGOCRIME\Months\ScreenShots"); foreach (string file in files) { string ext = Path.GetExtension(file); if (ext == ".png") { string filenameNoExt = Path.GetFileNameWithoutExtension(file); string filenameExt = Path.GetFileName(file); Directory.CreateDirectory(@"c:\ImageConversion\" + filenameNoExt); Process imProcess = new Process(); string im_command = file + @" -crop 800x800+500+300 c:\__FULLCHICAGOCRIME\Months\ScreenShots\cropped\" + filenameNoExt + "_cropped.png"; imProcess.StartInfo.UseShellExecute = false; imProcess.StartInfo.RedirectStandardOutput = true; imProcess.StartInfo.FileName = @"c:\__FULLCHICAGOCRIME\Months\ScreenShots\convert"; imProcess.StartInfo.Arguments = im_command; imProcess.Start(); imProcess.WaitForExit(); } } |
Now I have the frames for my animation.
Lastly, I append all these images into a movie using Windows Movie Maker, and add some Beethoven as background music.