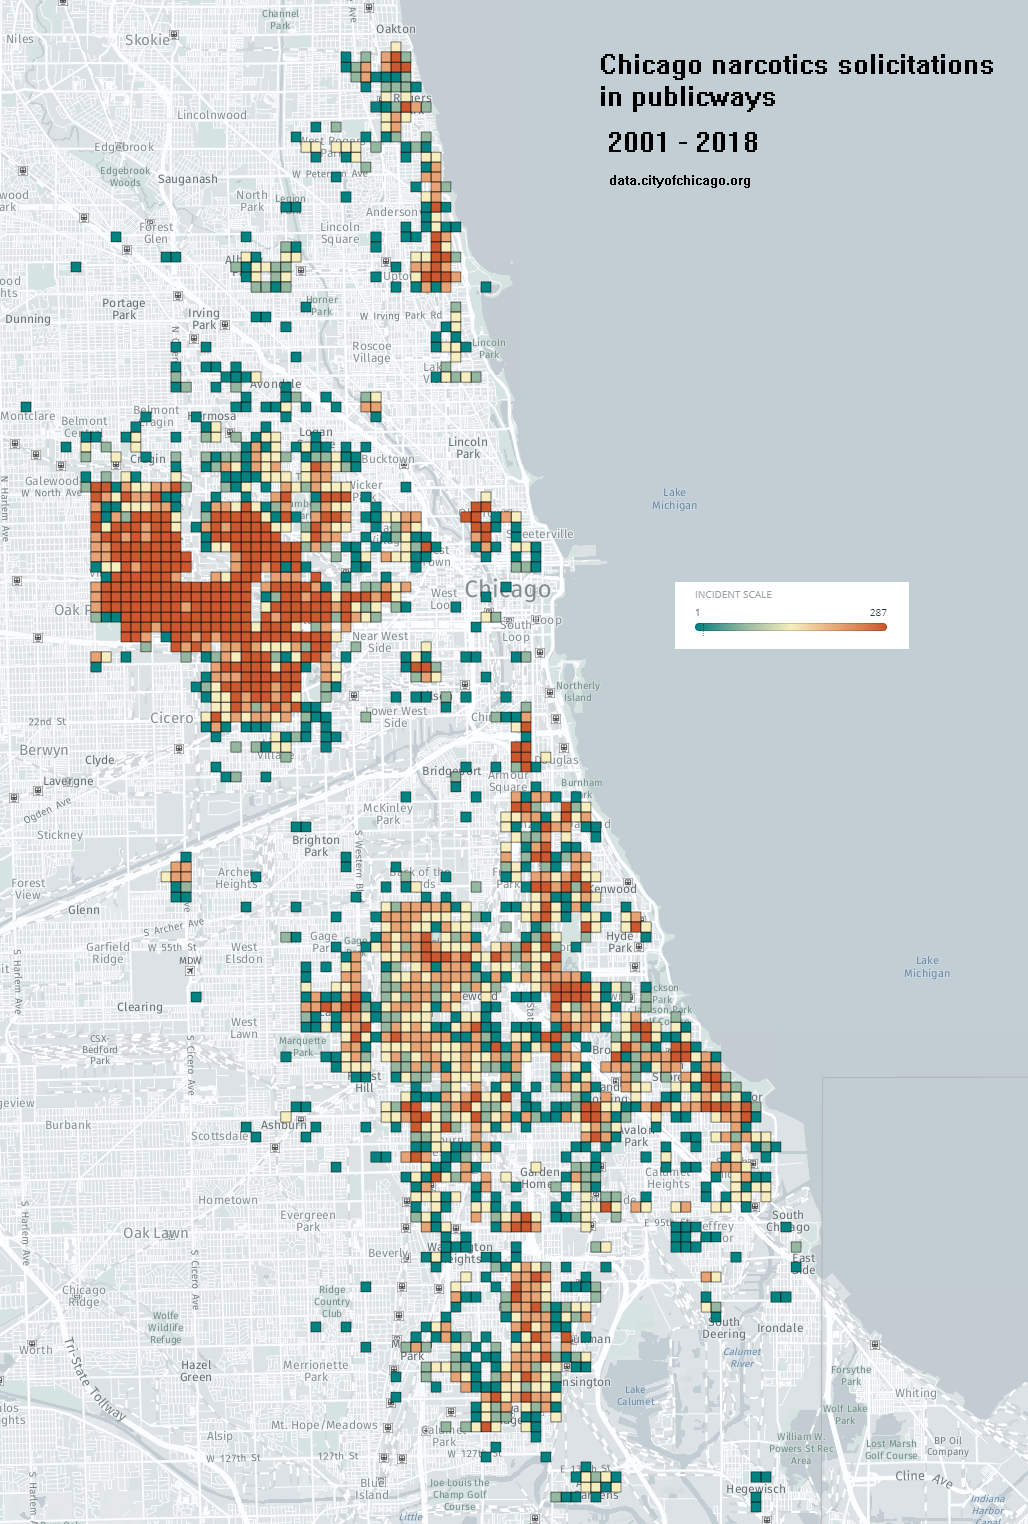
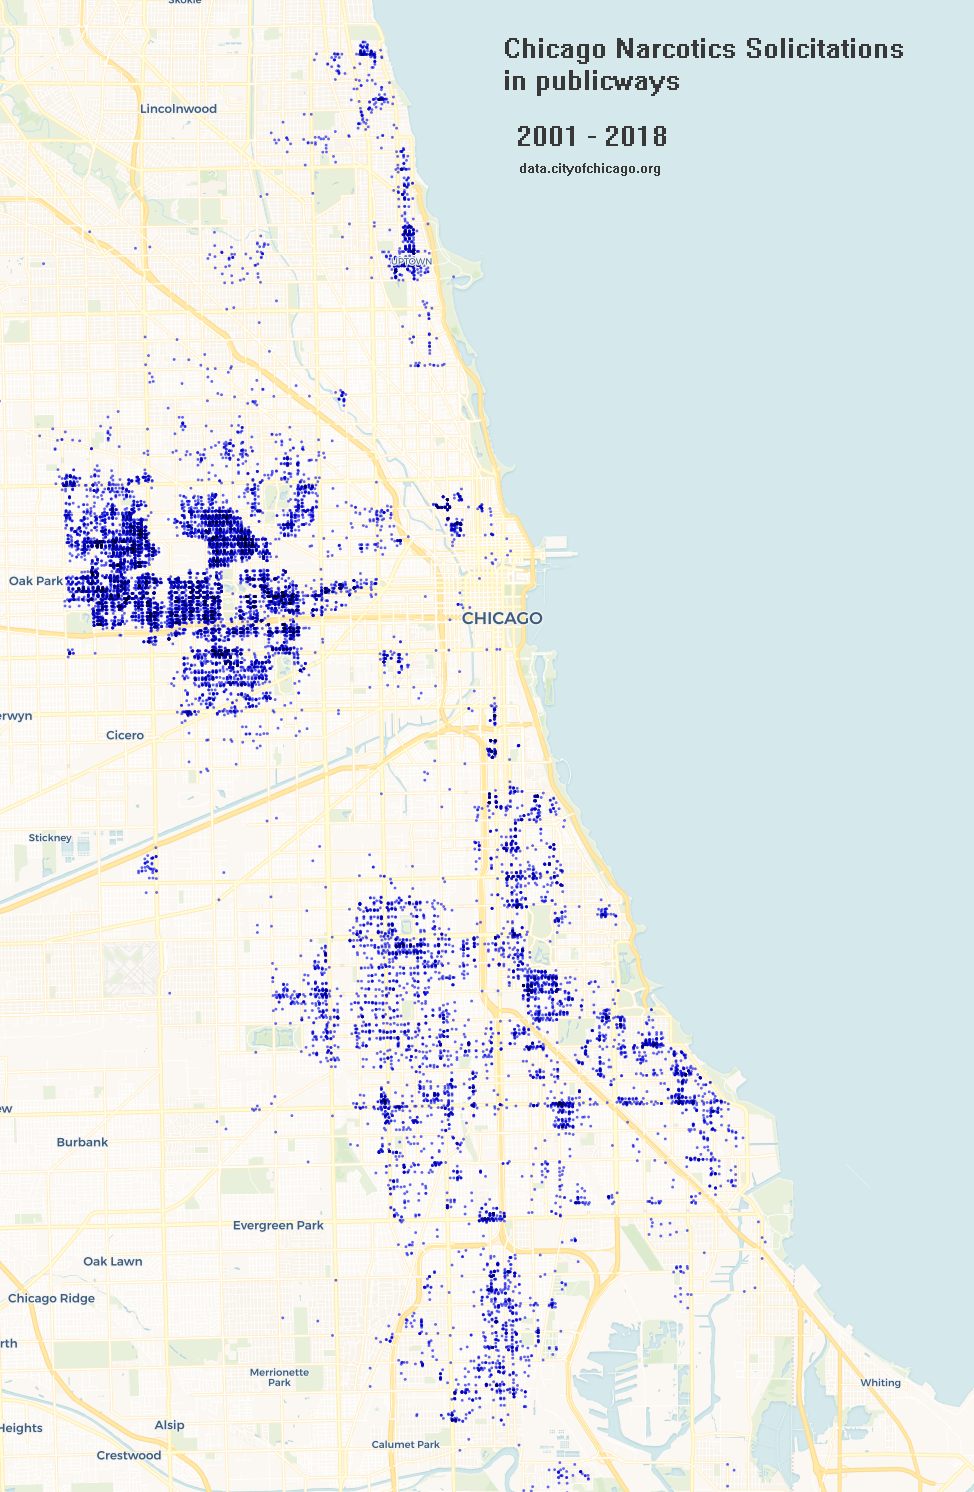
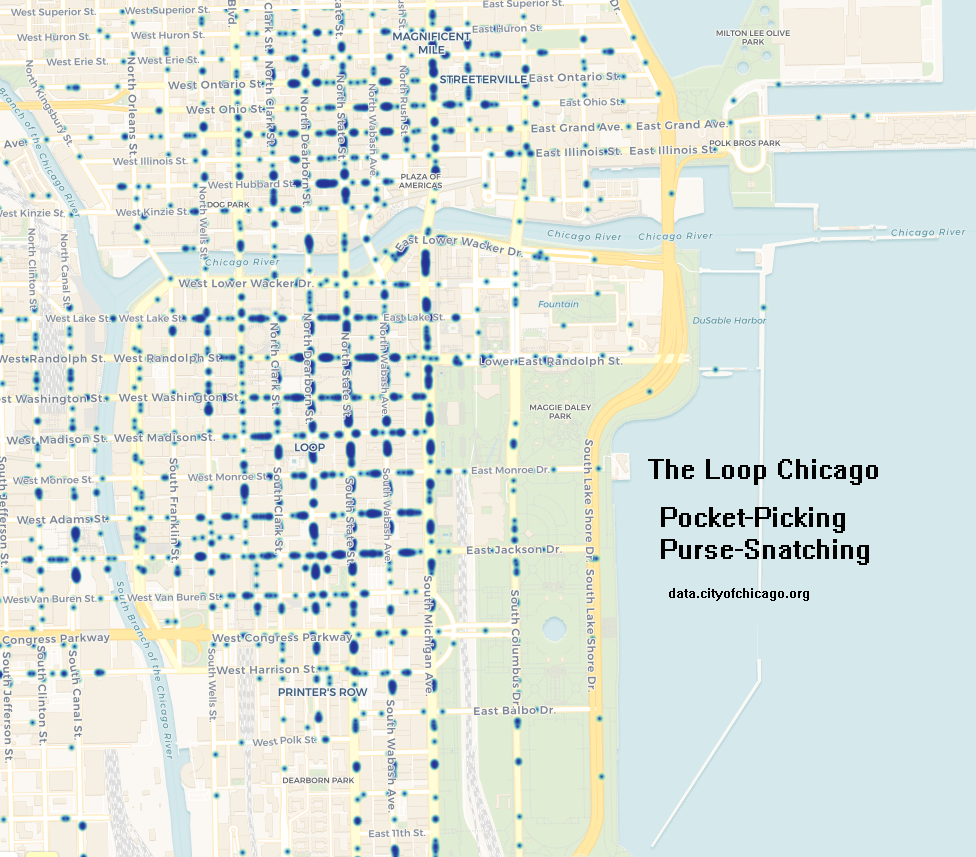
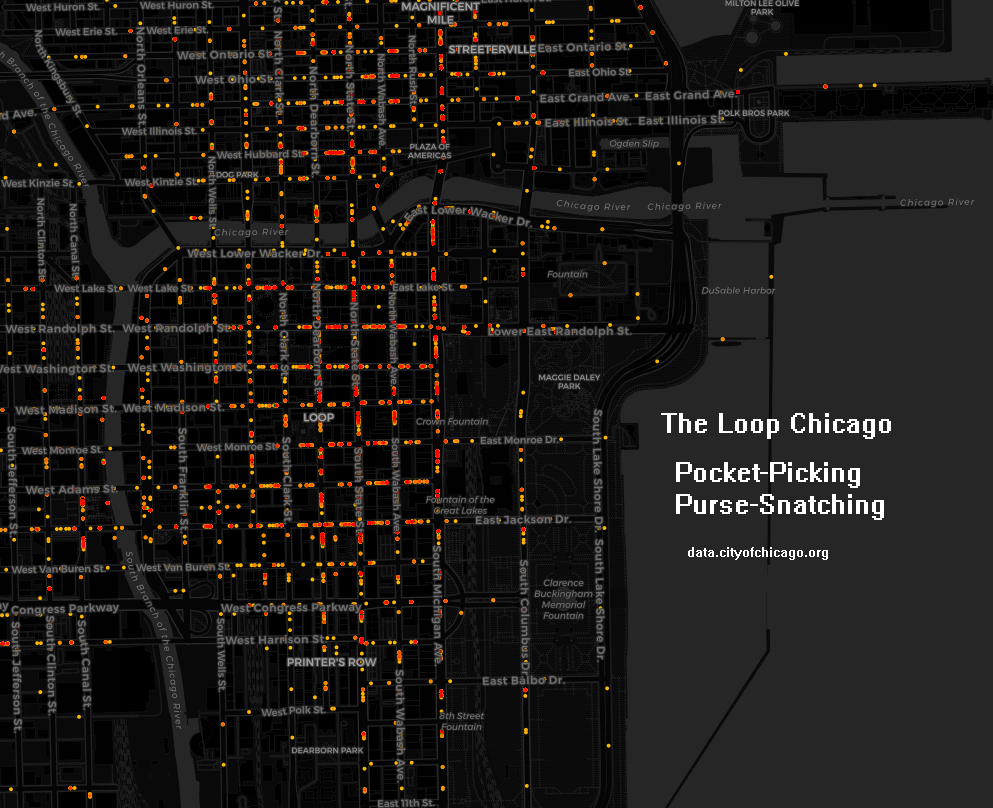
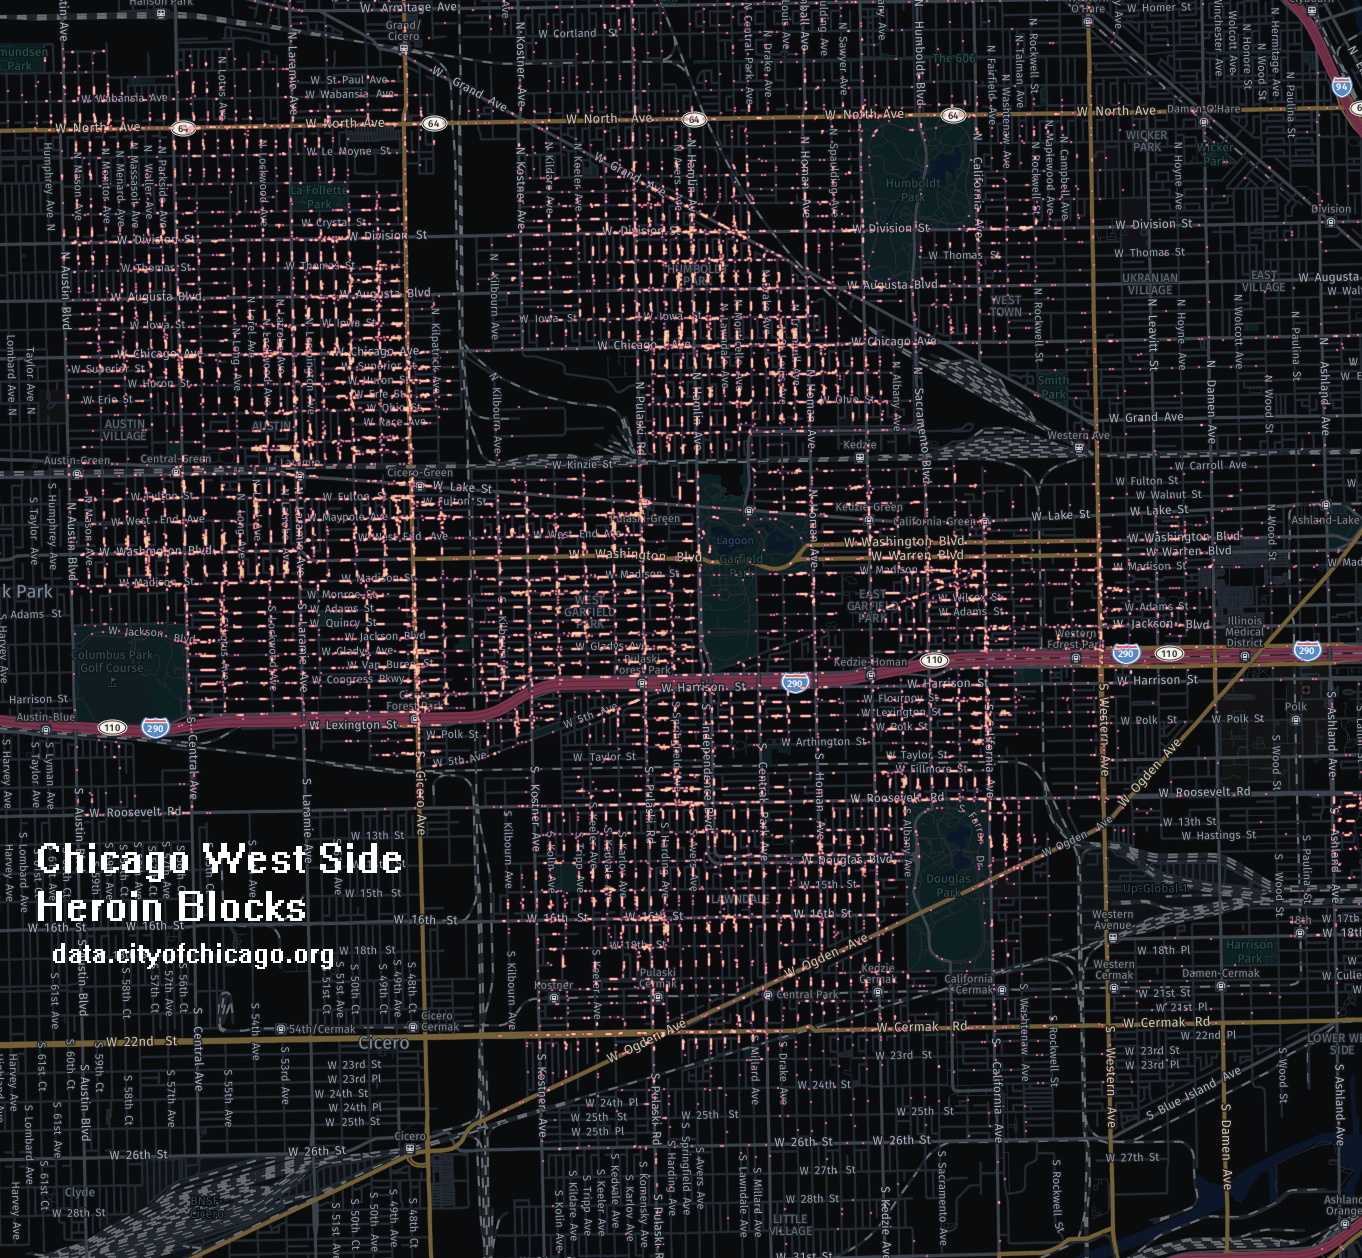
Where will you be offered narcotics in Chicago? Or, where do cops go to do undercover busts.
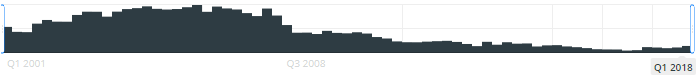
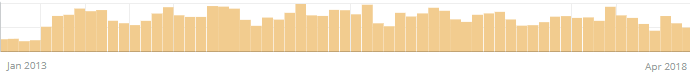
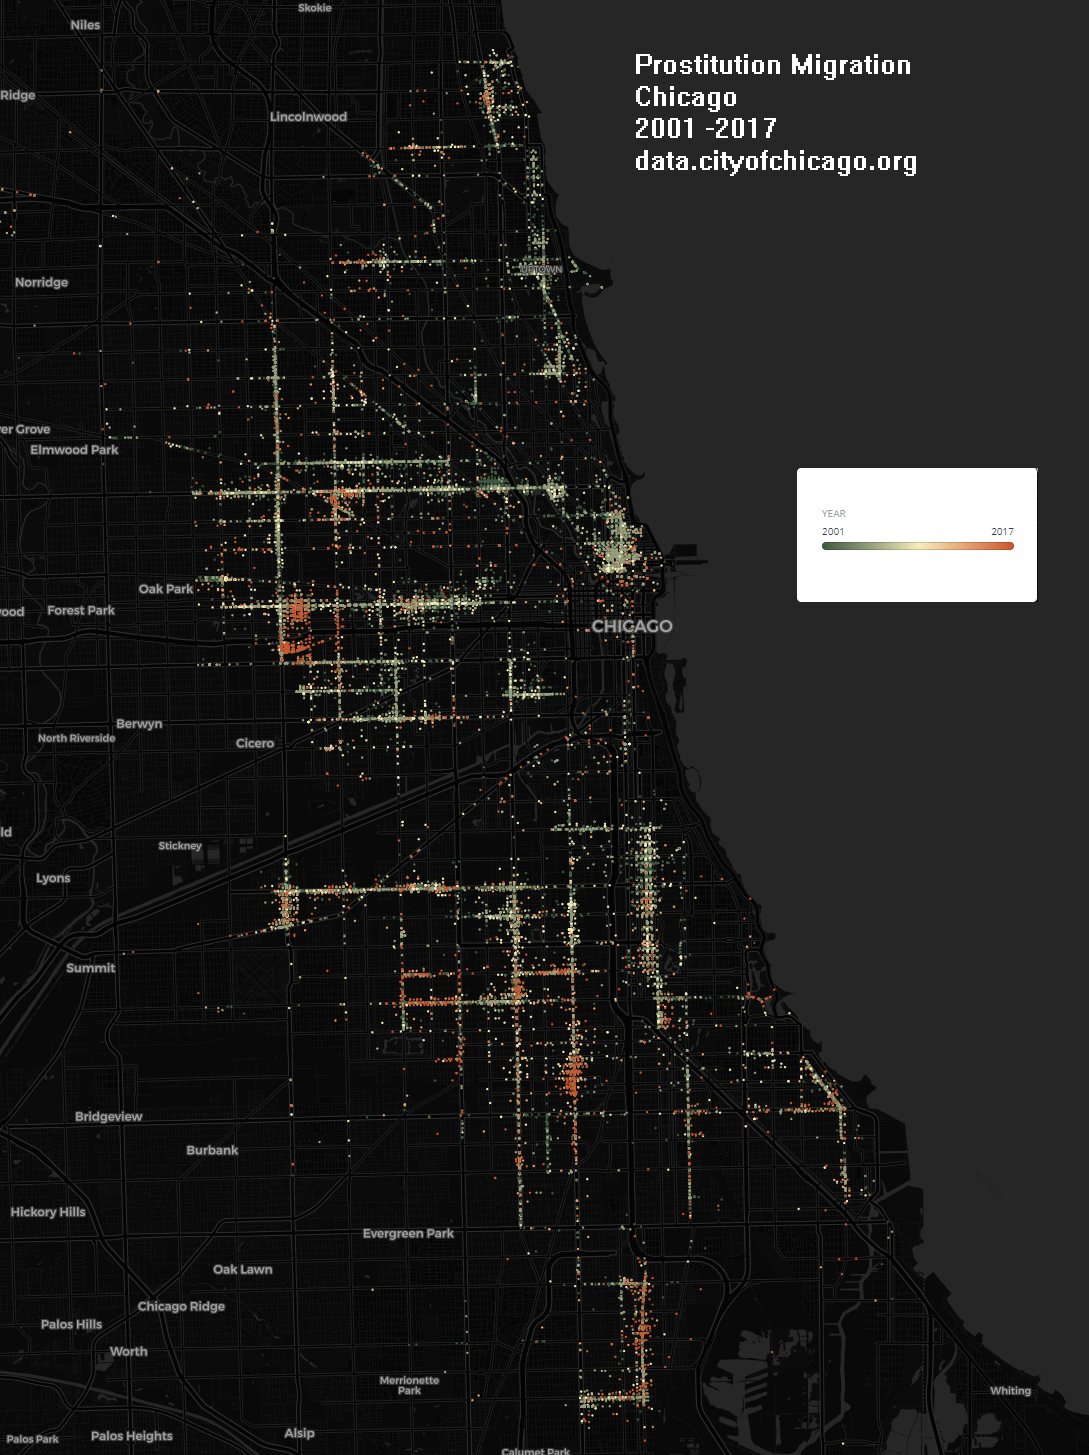
Crime incident reports are gathered by the Chicago Police Department. The time range spans from 2001 through 2018. The data is from data.cityofchicago.org.
Incident descriptors used:
NARCOTICS – Primary Type
SOLICIT NARCOTICS ON PUBLICWAY – Description
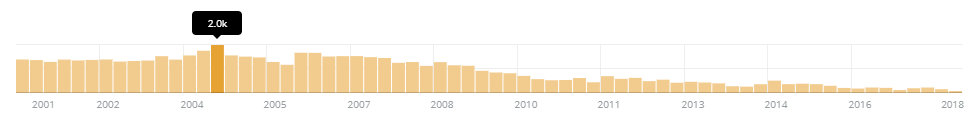
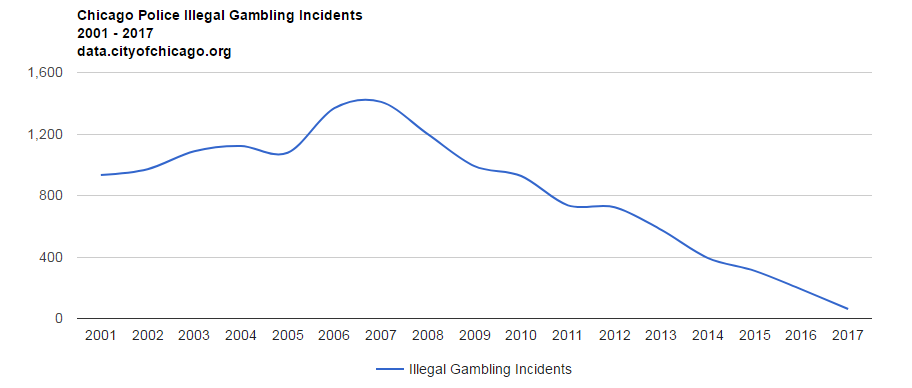
A decline in publicway narcotic solicitations or enforcement can be noticed around 2008.