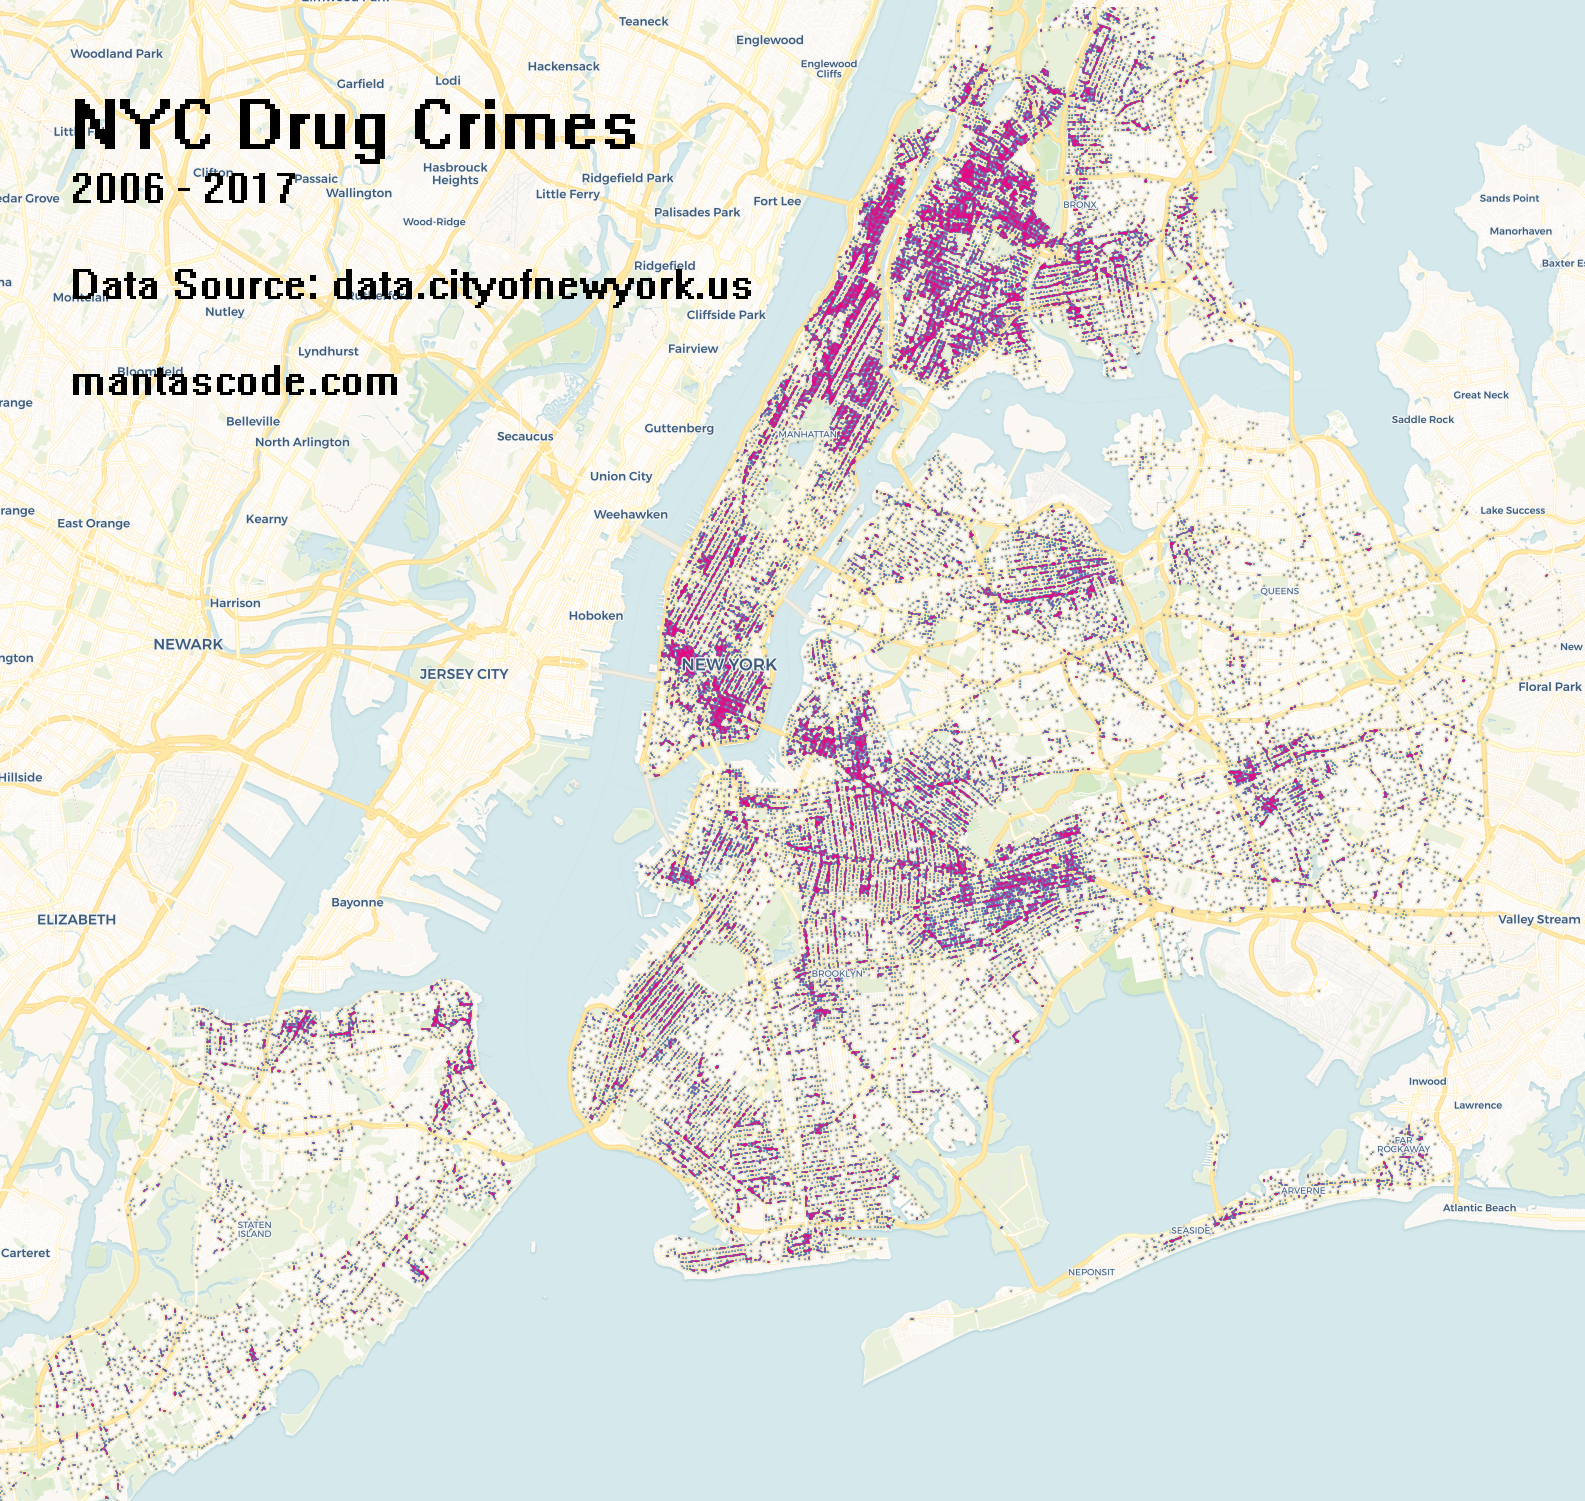
The data is collected by the New York Police Department. It can be found here data.cityofnewyork.us. To create the maps below, the dataset titled “NYPD Complaint Data Historic” was filtered down by the calcification of “Dangerous Drugs”. Carto was used to render maps.
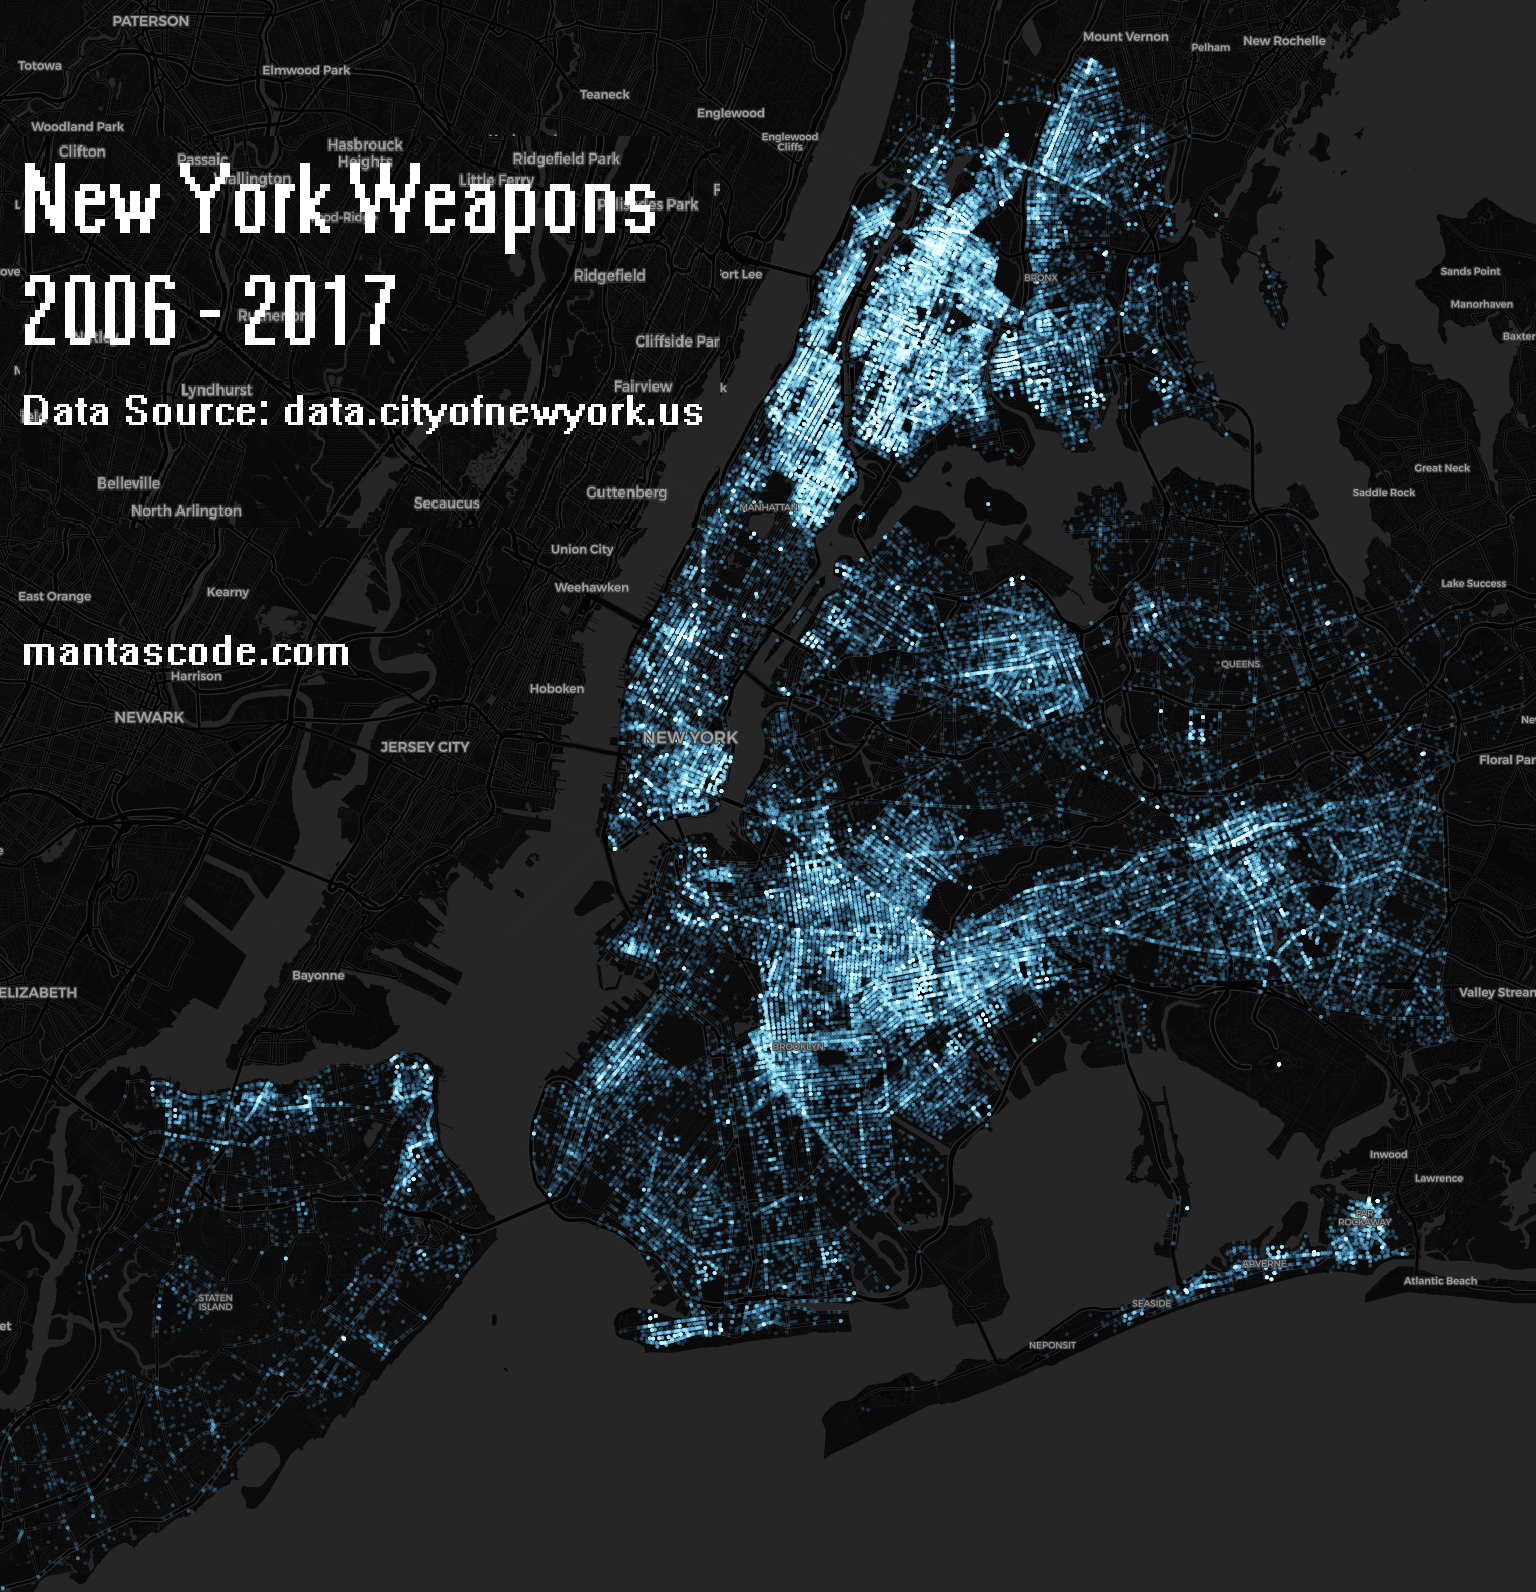
[1261×341] Point map of incidents with screening. Click to enlarge.
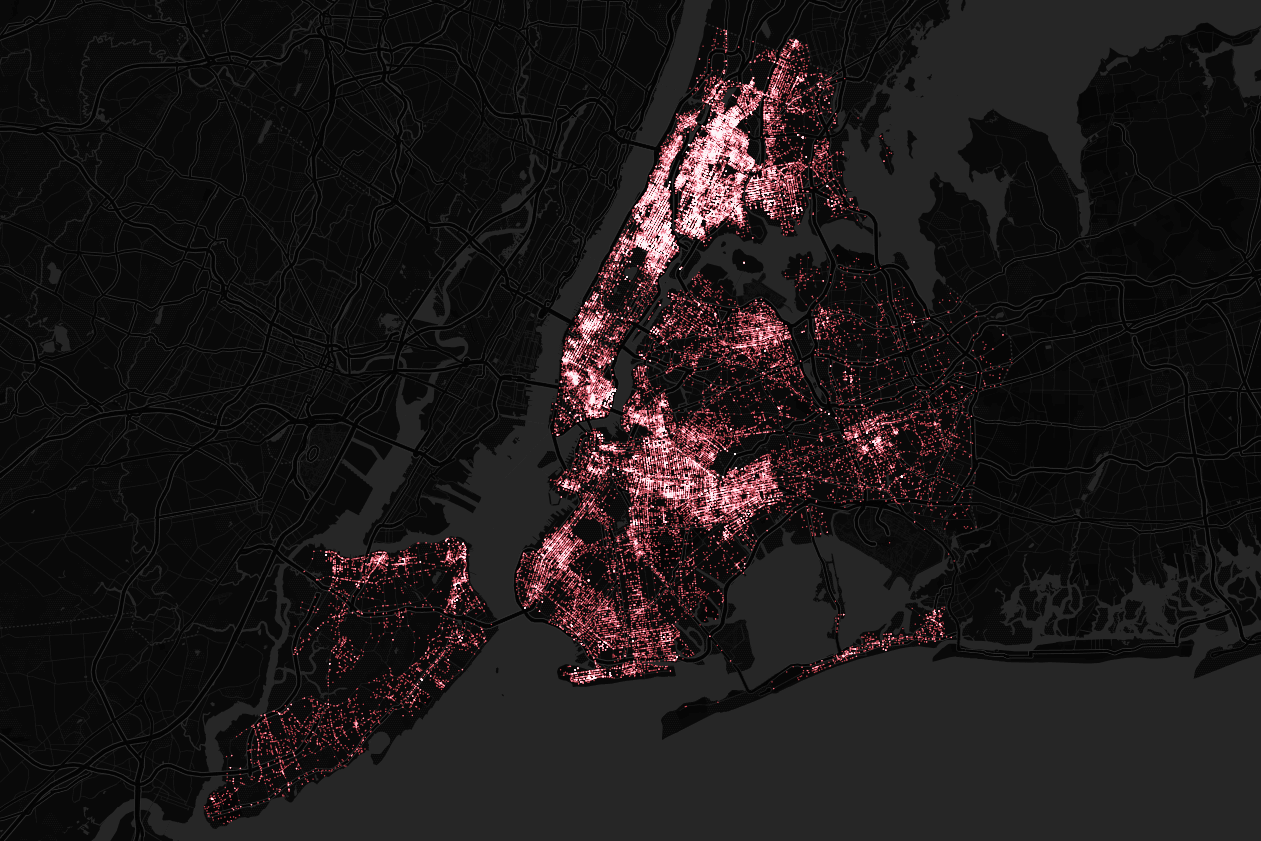
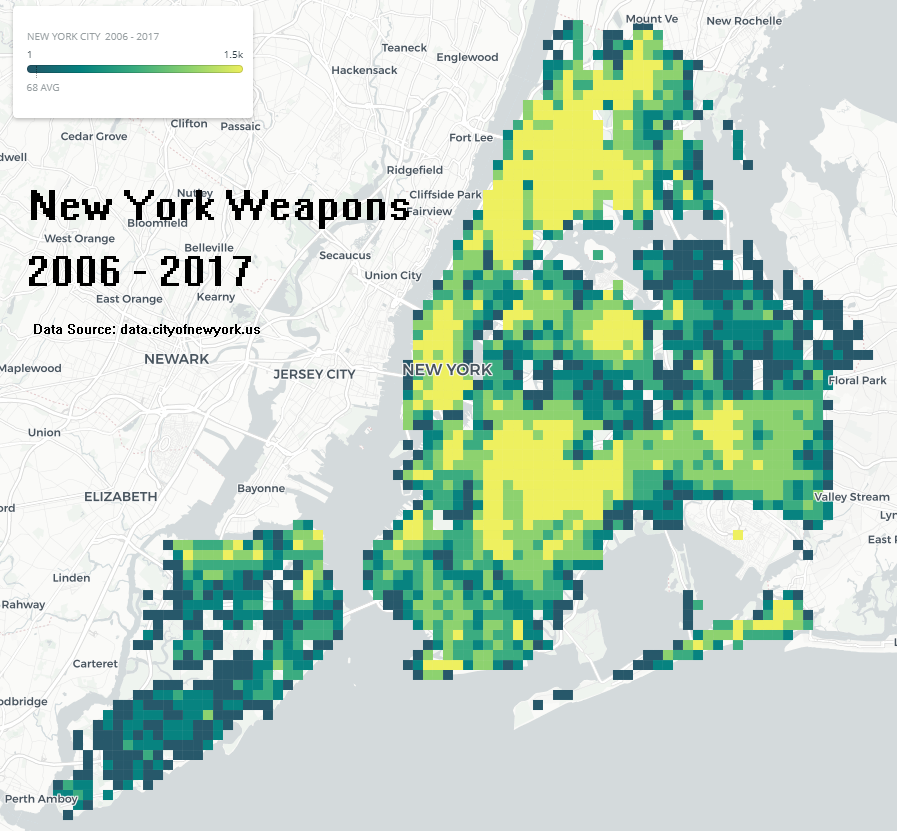
[1585×1501] Heat map of incidents. Click to enlarge.
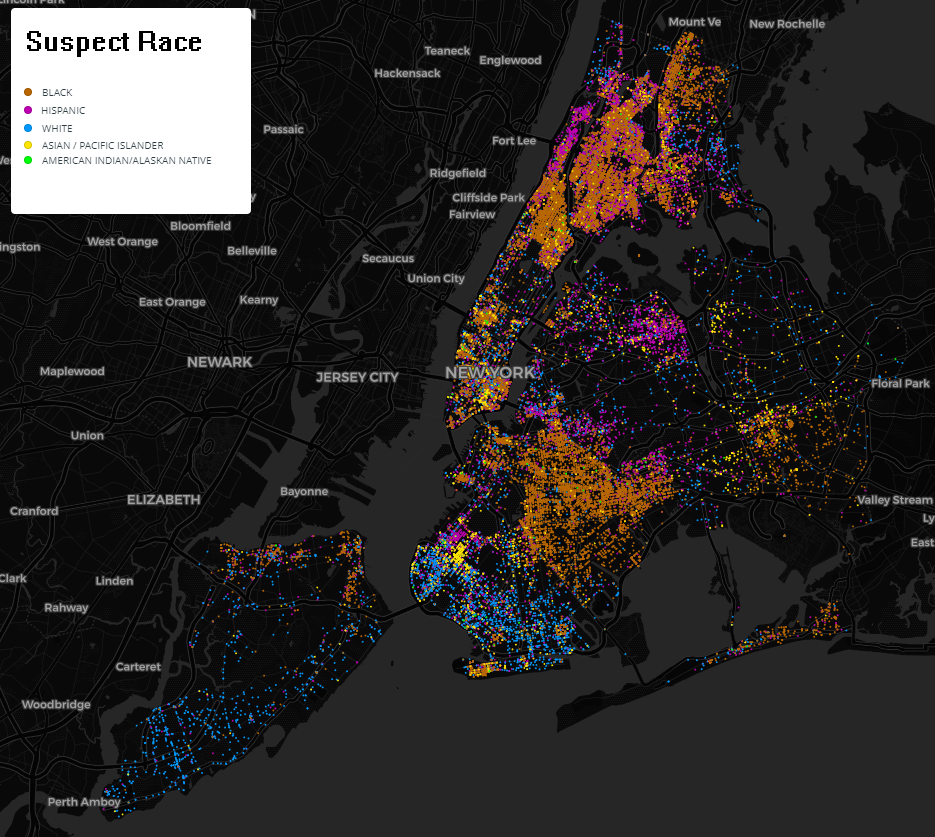
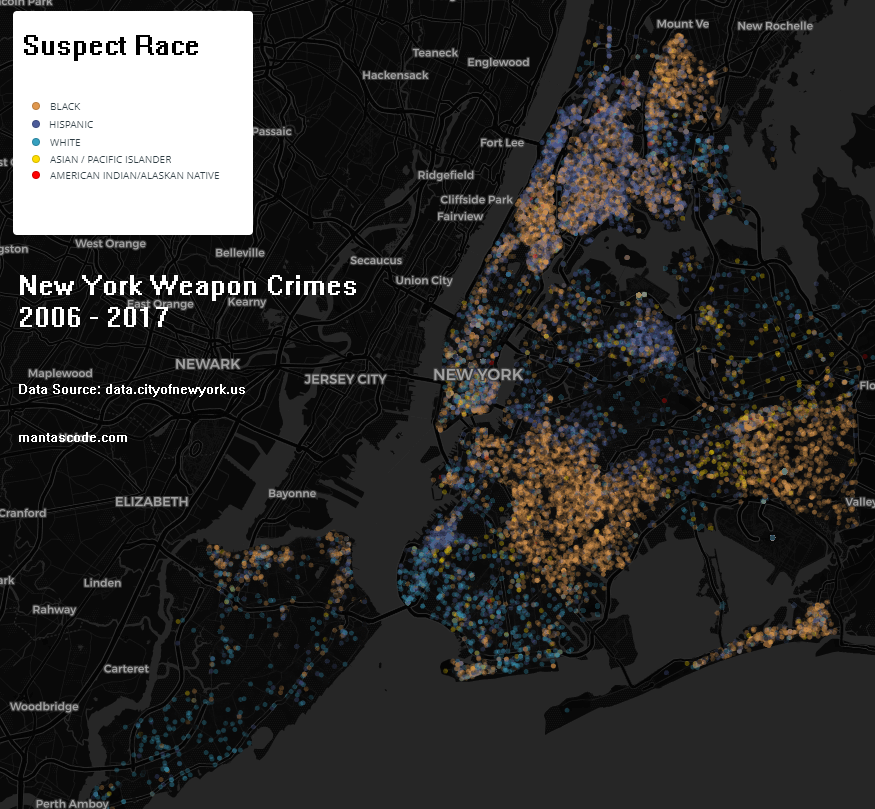
[935×837] Categorical point map by suspect’s race. Click to enlarge.