The data is from seanlahman.com.
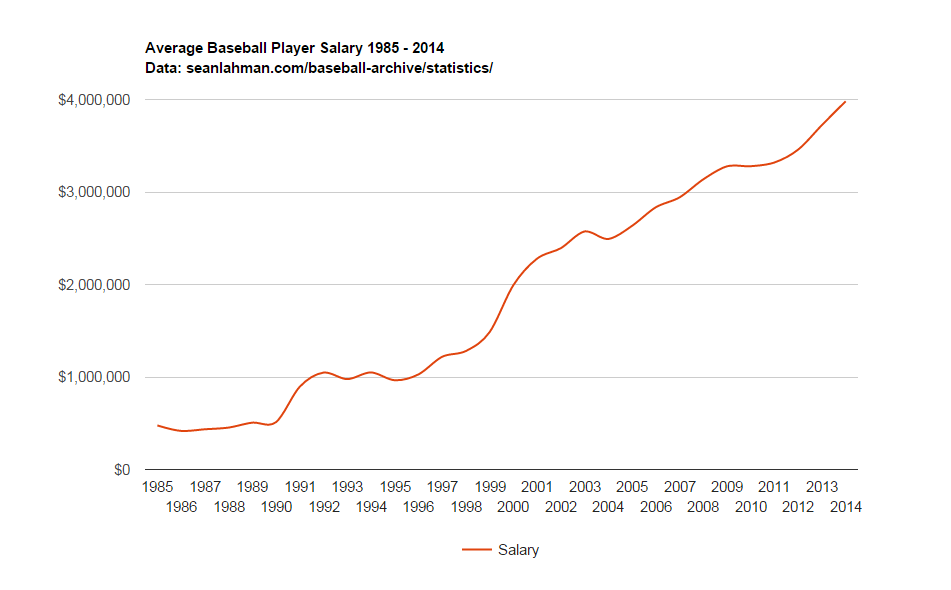
C# Console Application written to parse the csv dataset and create json output for a google charts line graph.
Continue reading

The data is from seanlahman.com.
C# Console Application written to parse the csv dataset and create json output for a google charts line graph.
Continue reading
Another fun project using Processing.

The behavior is slightly different from my previous Processing submission. However, this time the snakes are afraid of black walls, and if they head in the direction of a wall, they turn around in the opposite direction.
Sweet visualization thingy here https://processing.org/.
I made a video.
https://vimeo.com/139664336
Code written using the rectangle class.
Continue reading
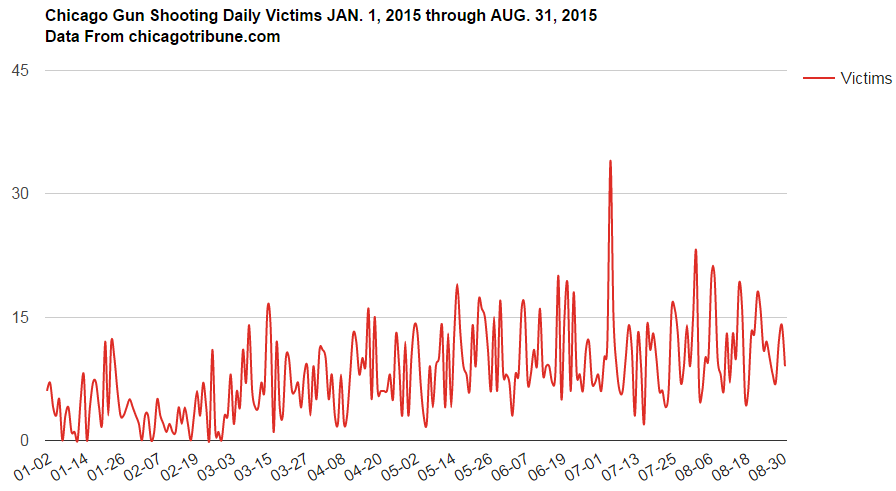
A different take on Chicago Tribune’s Gun Shooting visualizations. Time Range: JAN. 1, 2015 through AUG. 31, 2015.
The data was obtained and parsed from the Trib http://crime.chicagotribune.com/chicago/shootings
I made a daily line chart using Google Charts, and an overall intensity map using CartoDB.

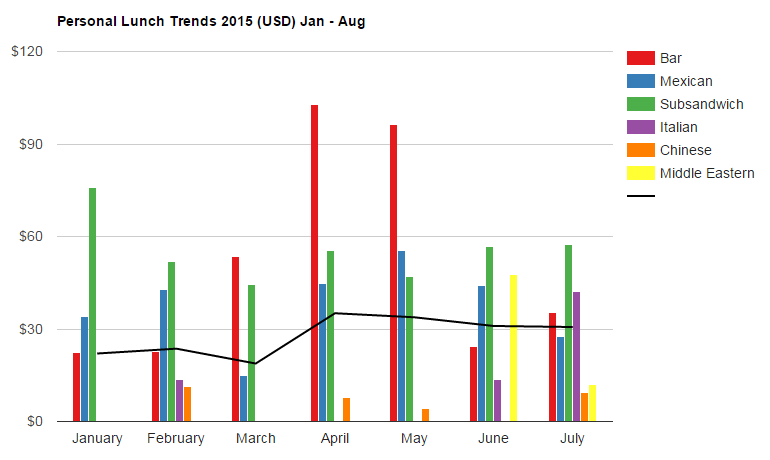
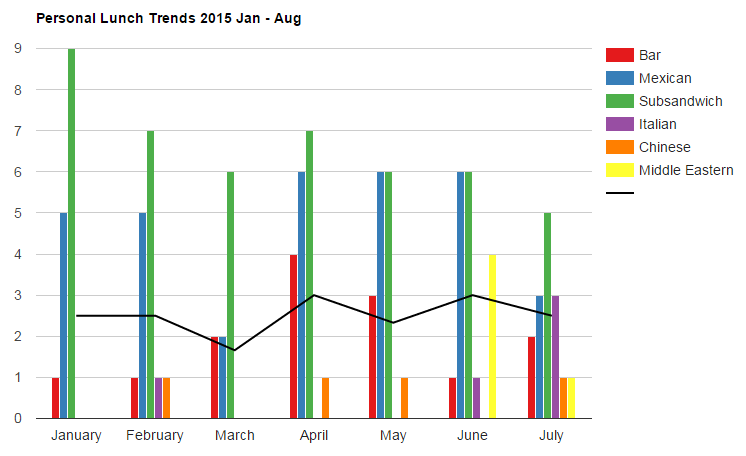
So I decided to parse out where I go to lunch on a regular workday. Working downtown in the city(USA), I walk to get lunch-in-a-bag somewhere within a short radius of the office. My decision of where I choose to go to lunch can be categorized like so: Sub sandwich, Chinese, Mexican, Italian, Middle Eastern, or Bar.
Everyday, I struggle making a decision. Everyday, only one choice is made.
Frequency
Monetary