
This morning I discovered an interesting data set
Historical Data About Every Reported United States Drone Strike
from http://dronestre.am/

THIS DATA WAS ACCESSED 8/31/2013
So I decided to make some quick visualizations using Google api.
The Data can be downloaded in JSON format and looks like this:
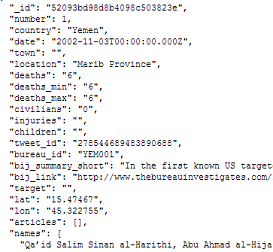
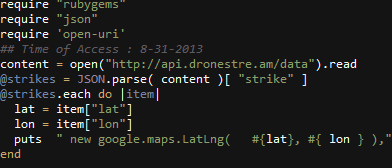
Parse out the coordinates of each strike using ruby:
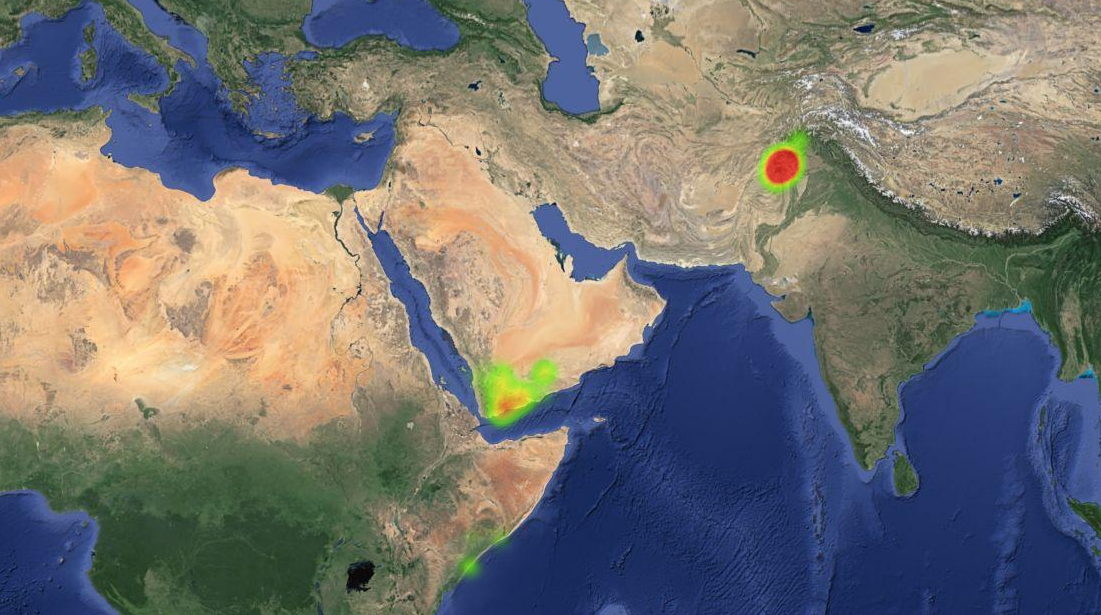
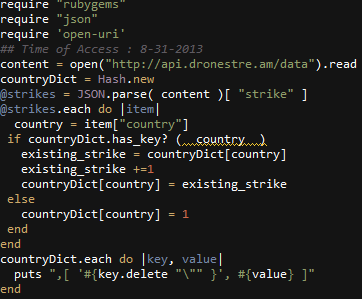
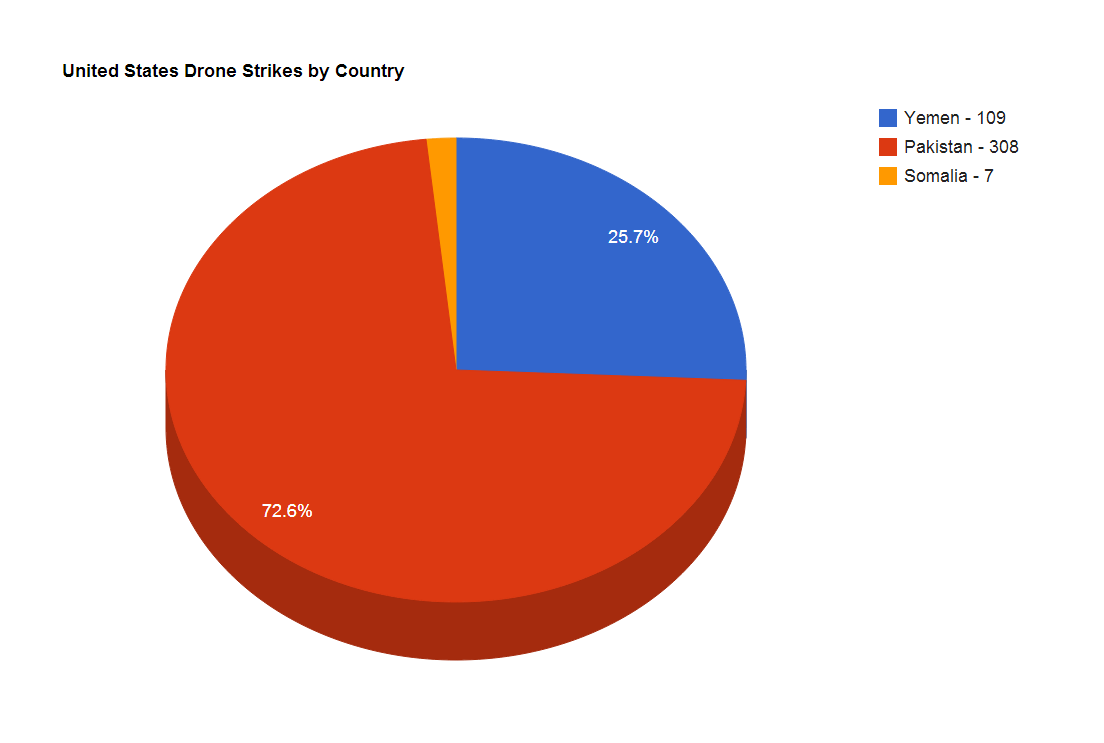
Accumulate strike totals by country:
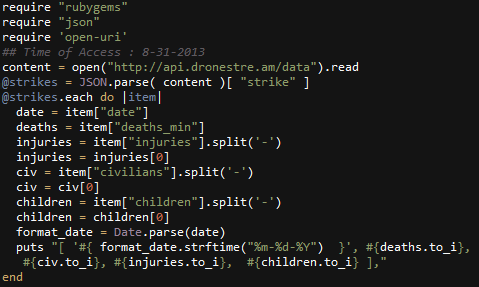
Code to display the date of a strike, and its attributes; deaths, civilians, injuries, and children.
Reported US Drone Strikes 2012 – 2013 stacked chart
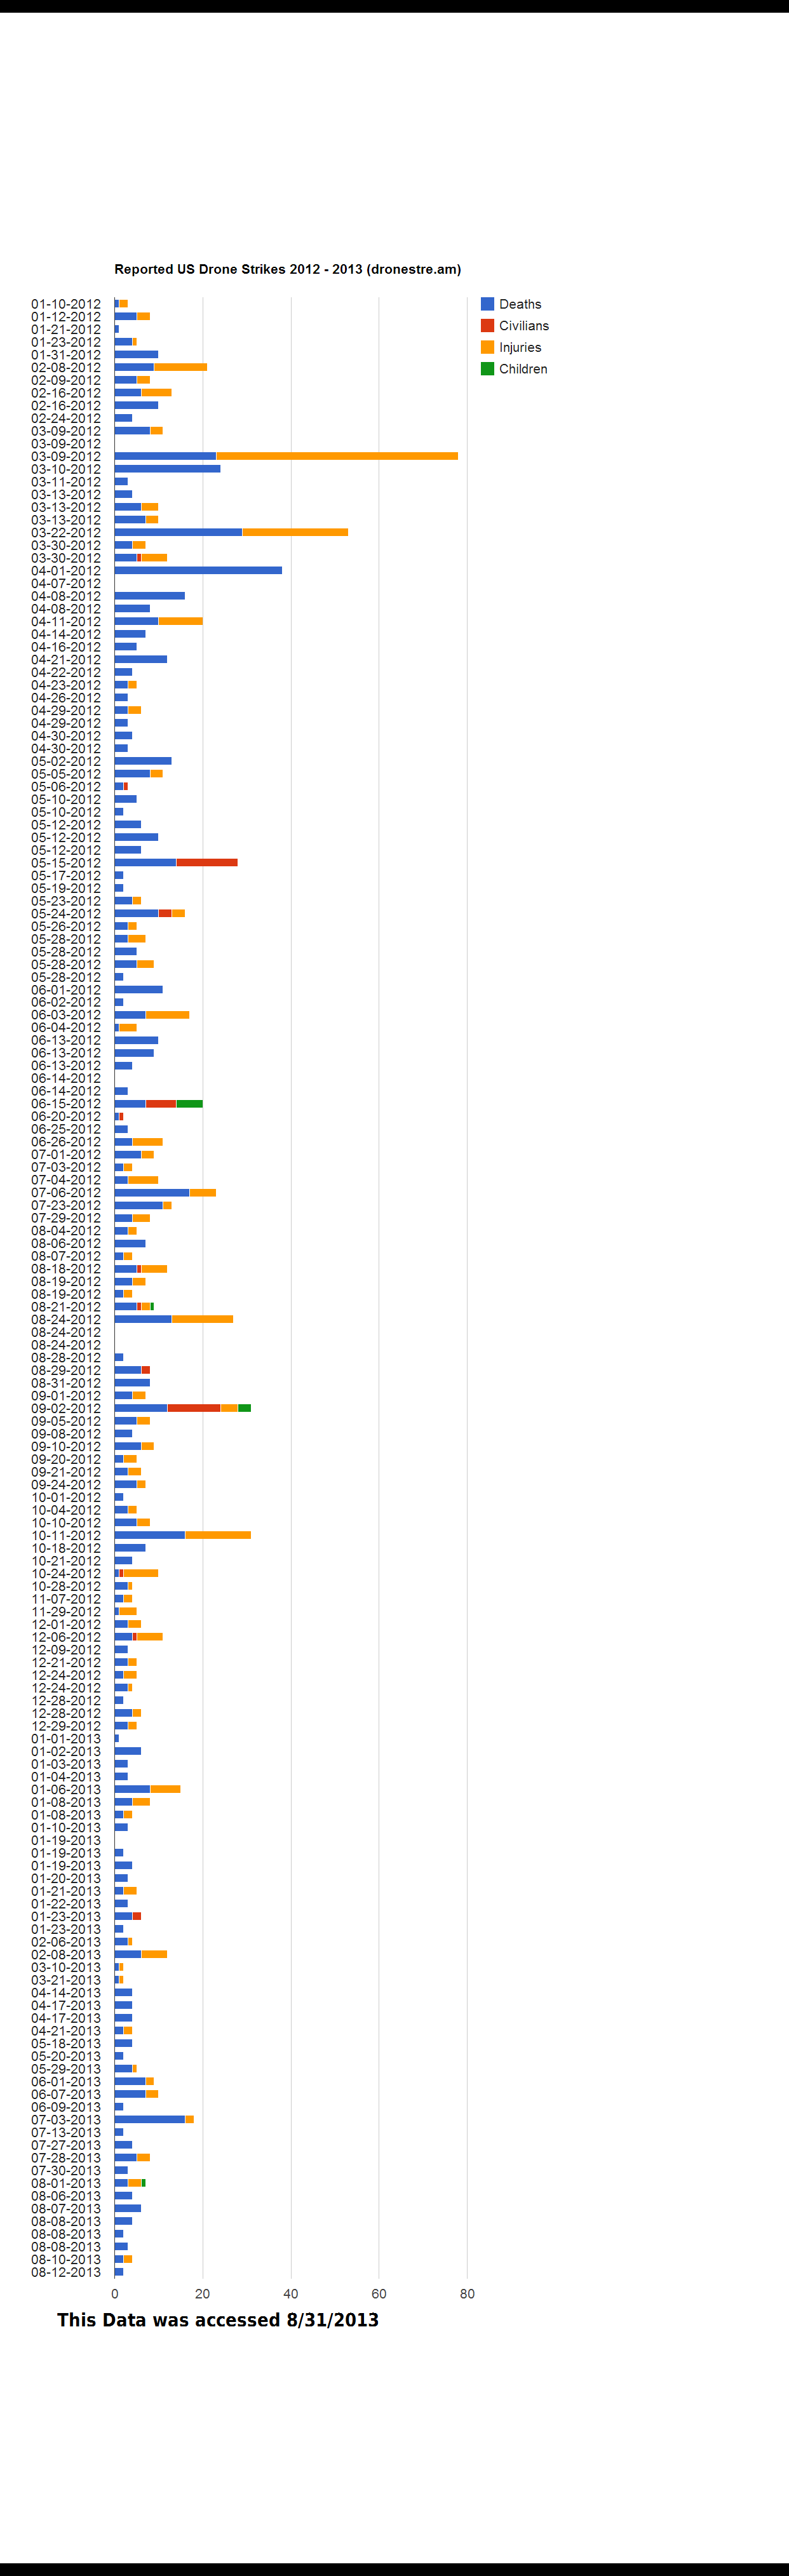
Entire Time Range of drone.am dataset accessed 8/31/2013
Hi there,
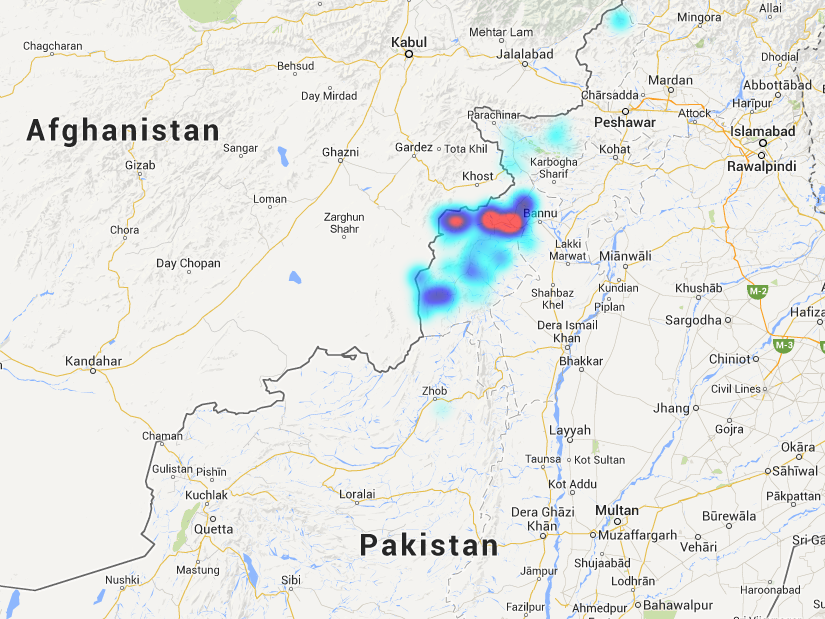
I’m doing a project on Islamic radicalization that will be applied to drone strike statistics. Is there any chance of getting an updated regional heat map?
all the best,
Sam Shaw