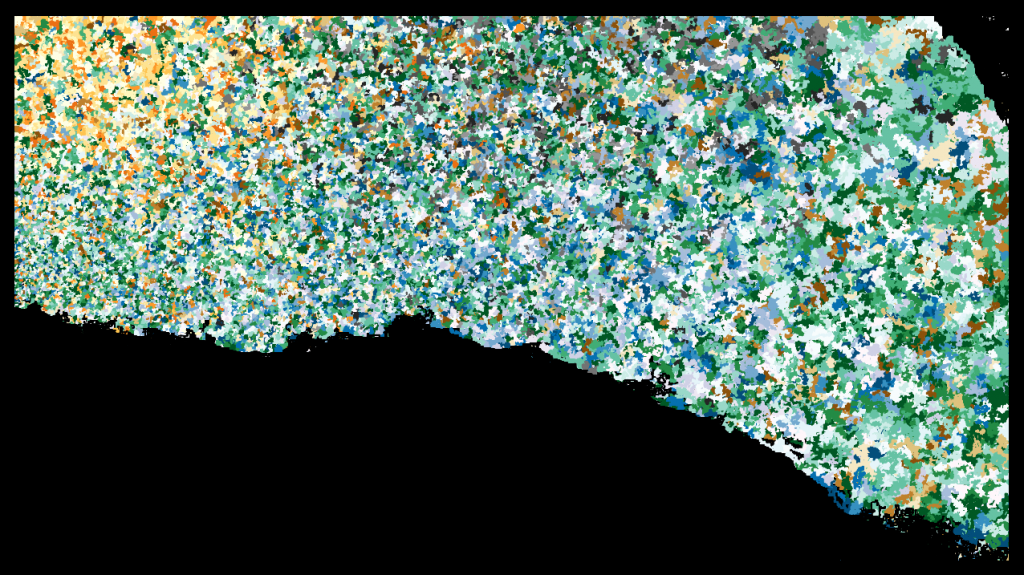
I attempted to create a painter’s landscape. I also added in a special character which has some strange growth properties from a previous post.

I attempted to create a painter’s landscape. I also added in a special character which has some strange growth properties from a previous post.
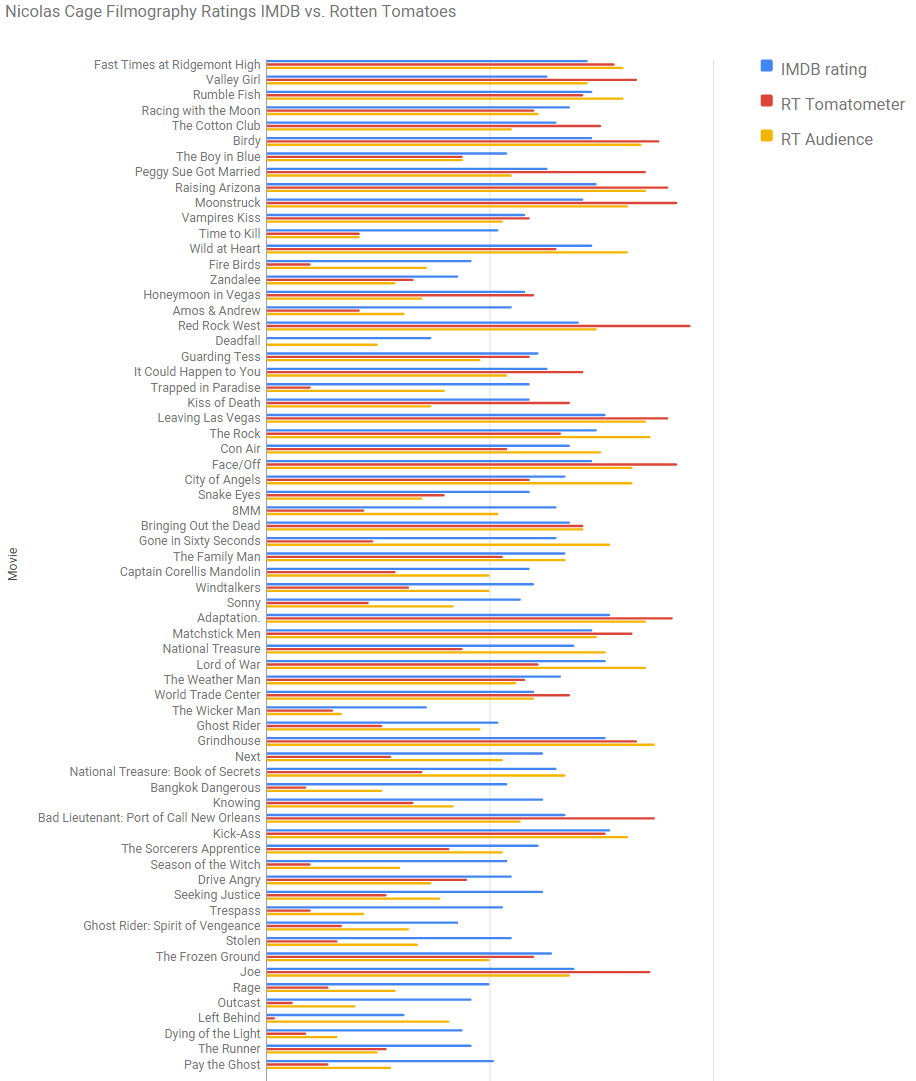
Linechart of movie review website ratings for each movie the Cage acted in from 1982 – 2015.
click on image for higher resolution

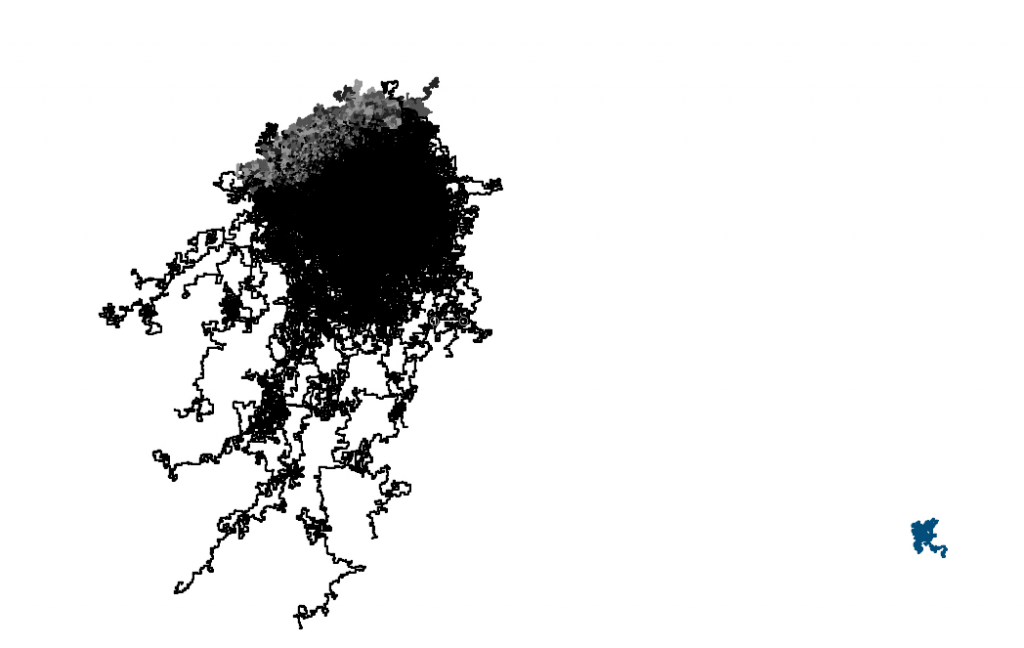
This video was made using Processing (Programming Language). It’s essentially about 1,000 differently colored lines traveling randomly, 1 pixel at a time. There is a condition that if a line is headed in the direction of a black color, it turns around and heads in the opposite direction. Some of the lines themselves are black, which created the “jellyfish”. The code written is a minor variation of Attack on Grayscale.
Camtasia was used for video editing, and the clips were sped up 700% to 4,000% of the original speed.
Watch! As color groups consume one another like rabid dogs.
Youtube
Vimeo
If you want to render it yourself at a speed of 1000% slower, copy and paste this code into Processing.
Continue reading
Silly project using processing 3.0. It’s essentially the same as my previous one(snakes maze) but with more colors.
Rules
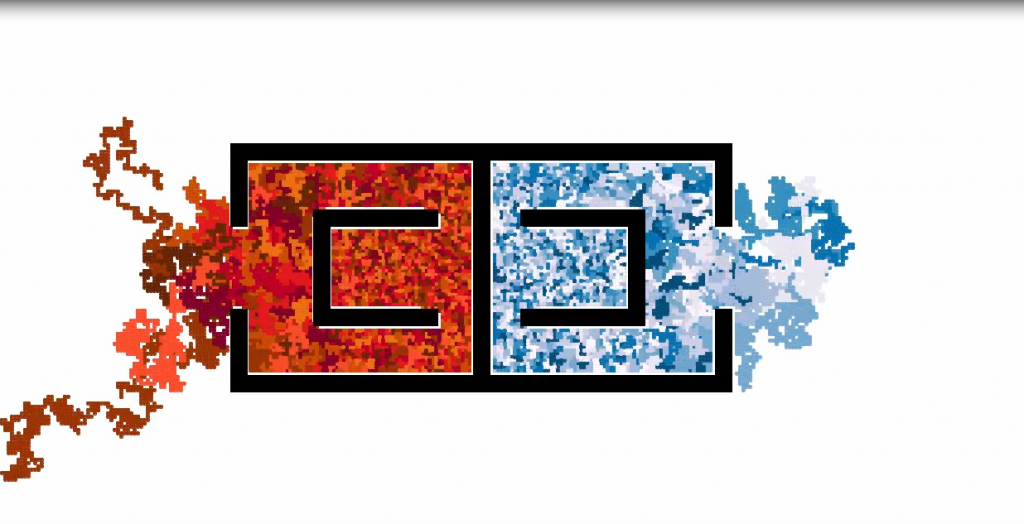
Full screen it! (WARNING: I’ve received a multitude of negative reviews about the music chosen. Also, note that youtube and vimeo compression does not look like the original, especially when smaller snake widths are chosen.) The video is sped up ~400%.
update
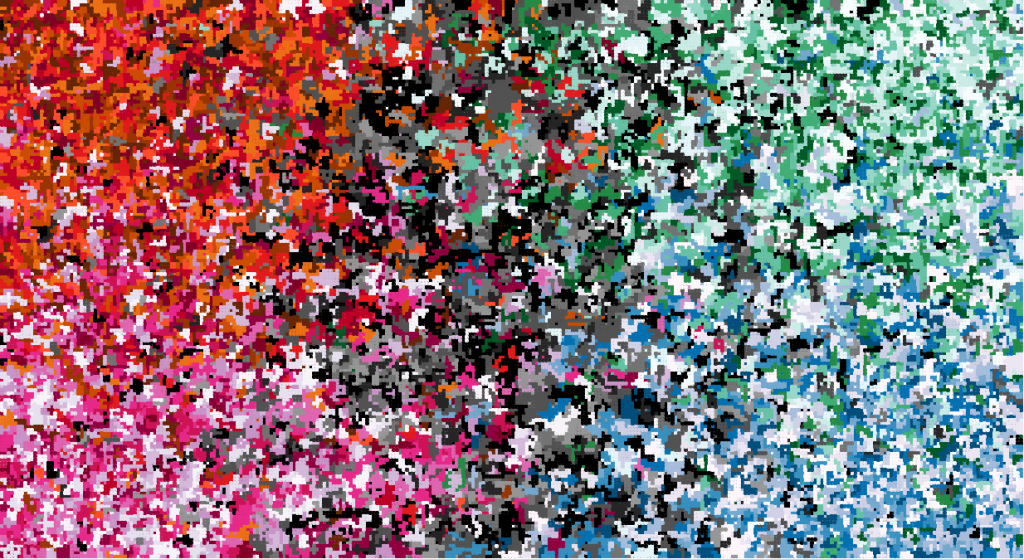
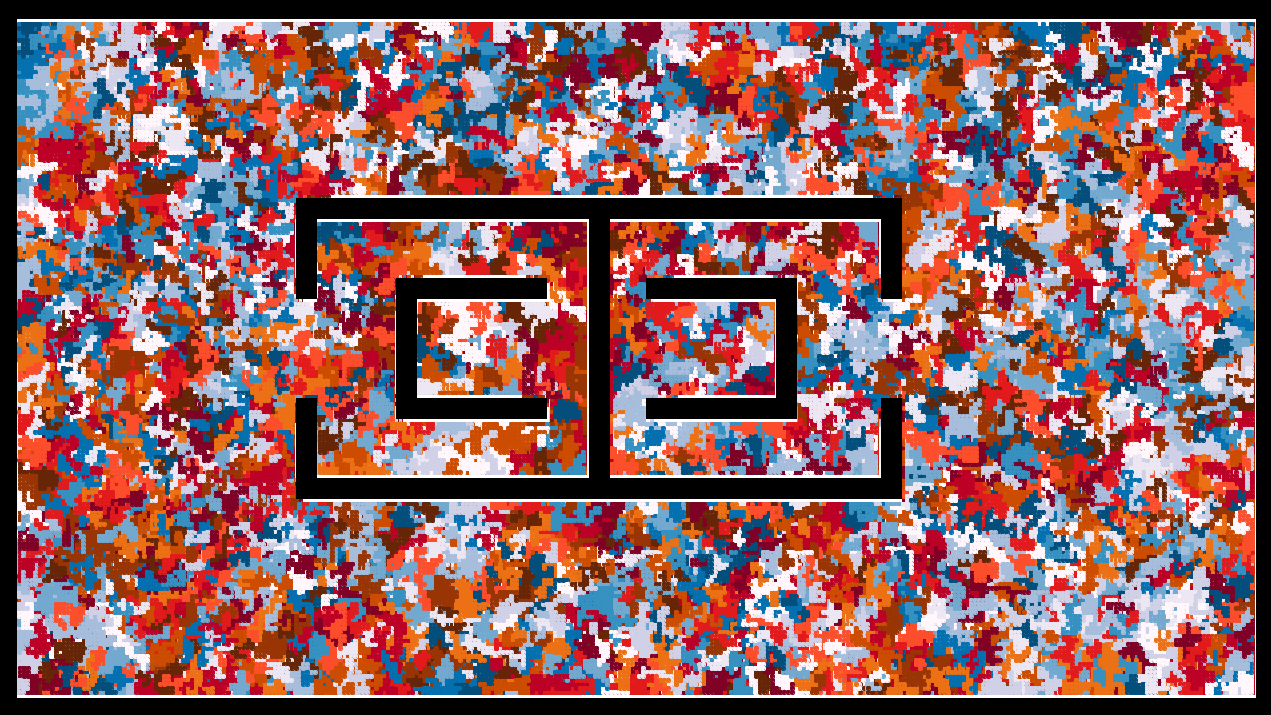
Someone asked me how long it would take 1 snake to travel to the other snake color group’s starting point. So I ran the experiment and responded with:
It took my computer approximately ~27 minutes for one snake to reach the other color group’s starting point. Here’s a picture:
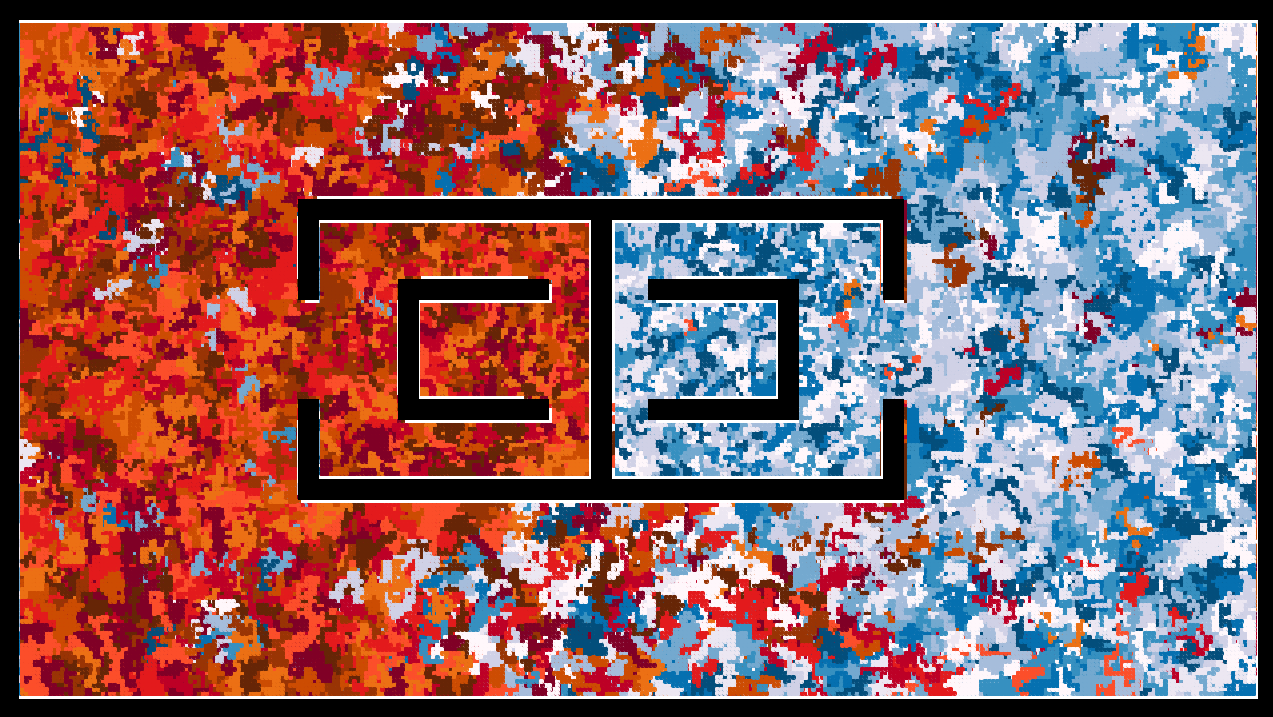
You can see a snake from the red group infiltrated blue’s base. Blue group almost won, got really close, but turned around last minute and lost interest in the objective.
I was thinking, perhaps this could be turned into some sort of high stakes casino game.
Patrons would place bets on either side, and the casino would take a rake from the total pot. Each “red vs. blue” event would be displayed on a huge monitor in a palatial area. The color groups could also be adjusted to match the theme/scheme palette of the casino.
It would be interesting to see a group of people, gathered around, financially invested, yelling angerly at some randomized color generation.
2 hours+
All I need is 1 giant flat screen TV, some sort of cheap dell server, a gambling licence, a marble stone coliseum structure, and electricity,to make my vision a reality.
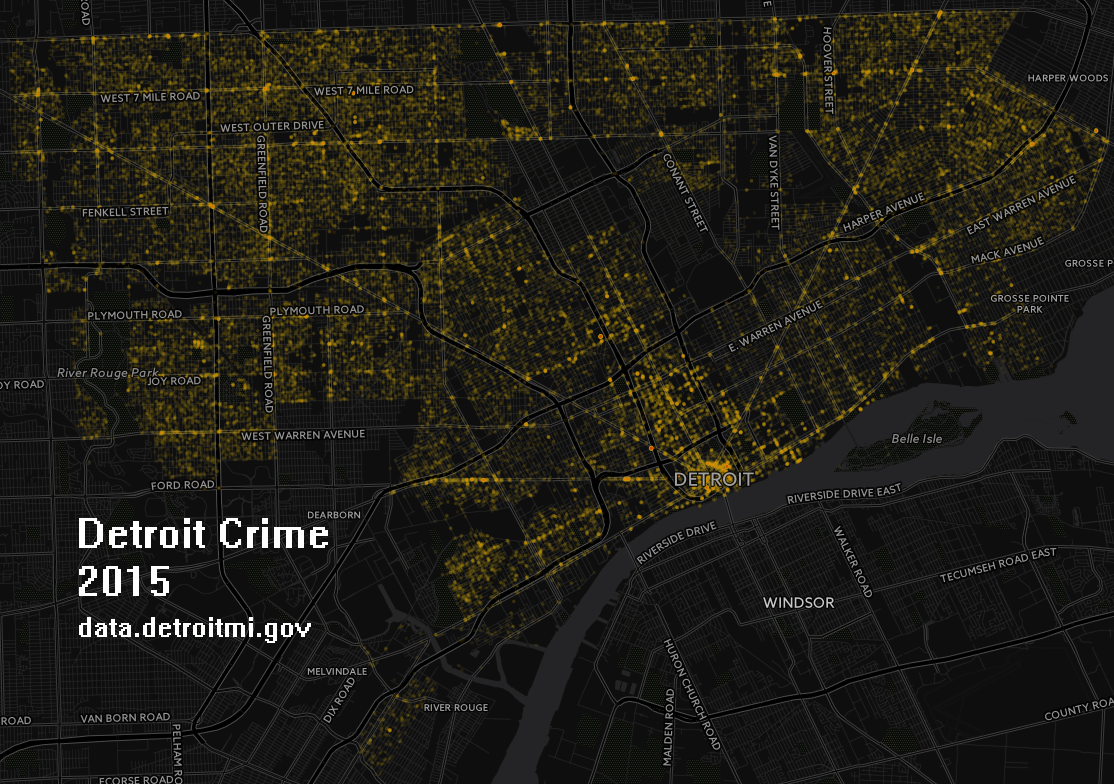
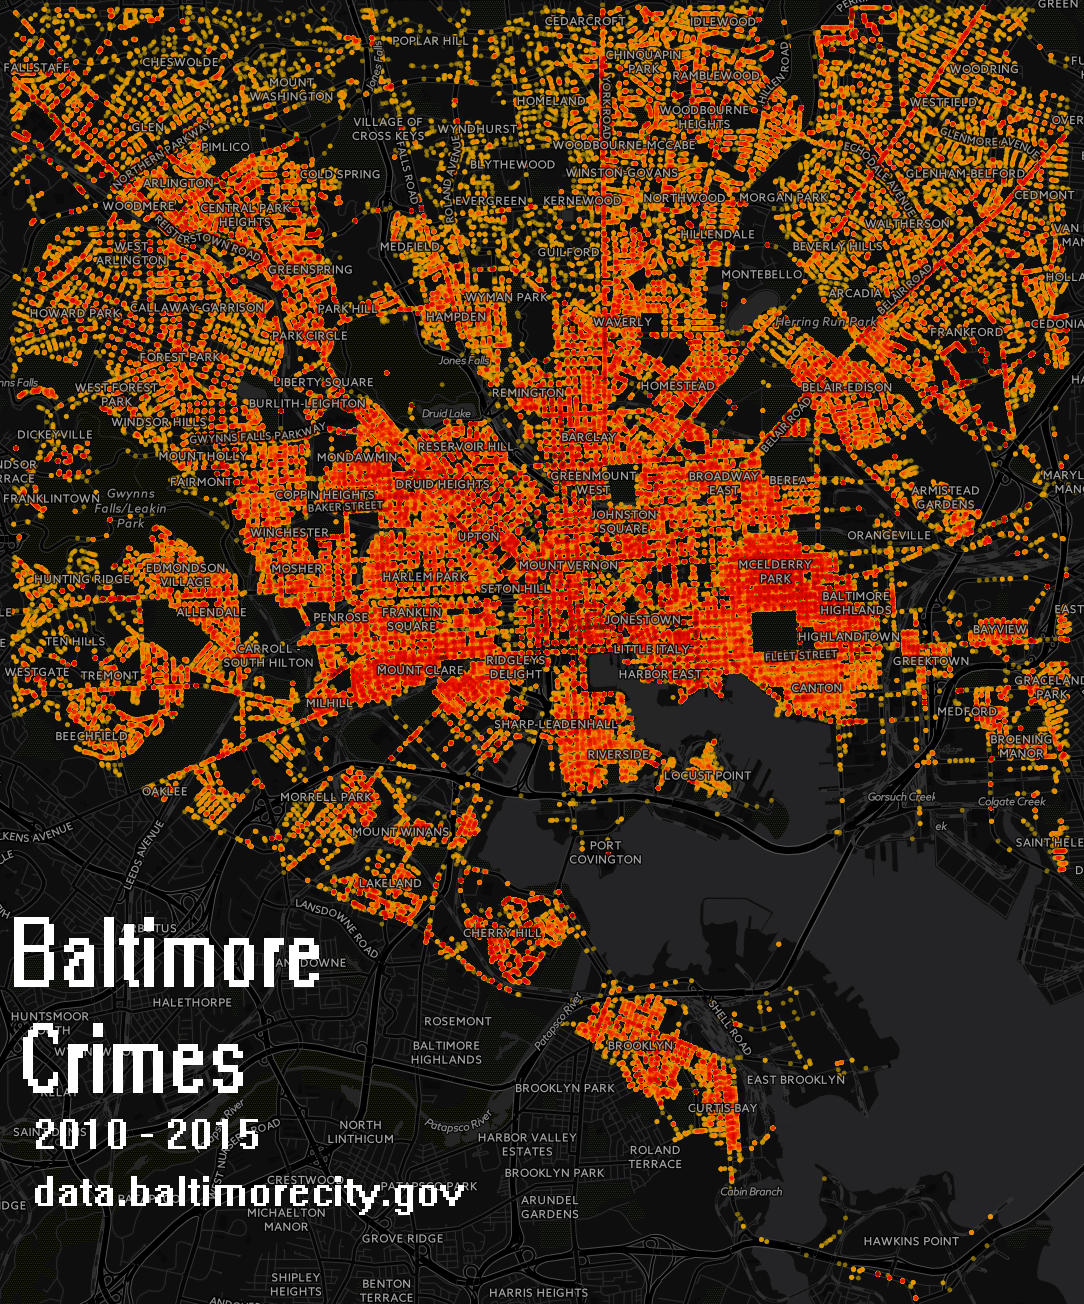
Crime in Baltimore USA from 2010 through 2015.
The data was found on data.baltimorecity.gov
Below I’ve created a static map of all crimes, and a geo temporal torque map video.
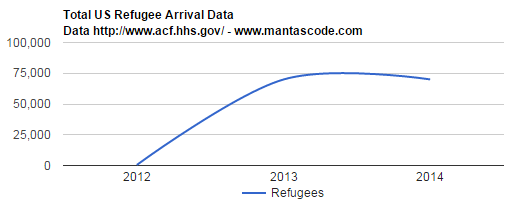
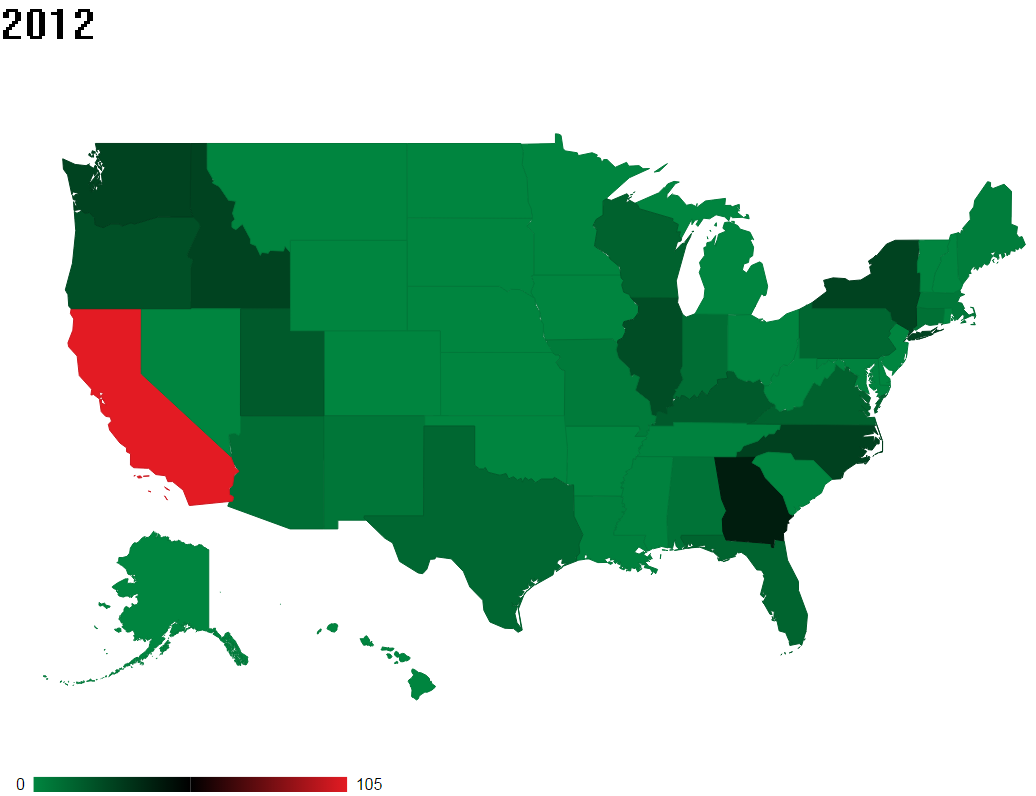
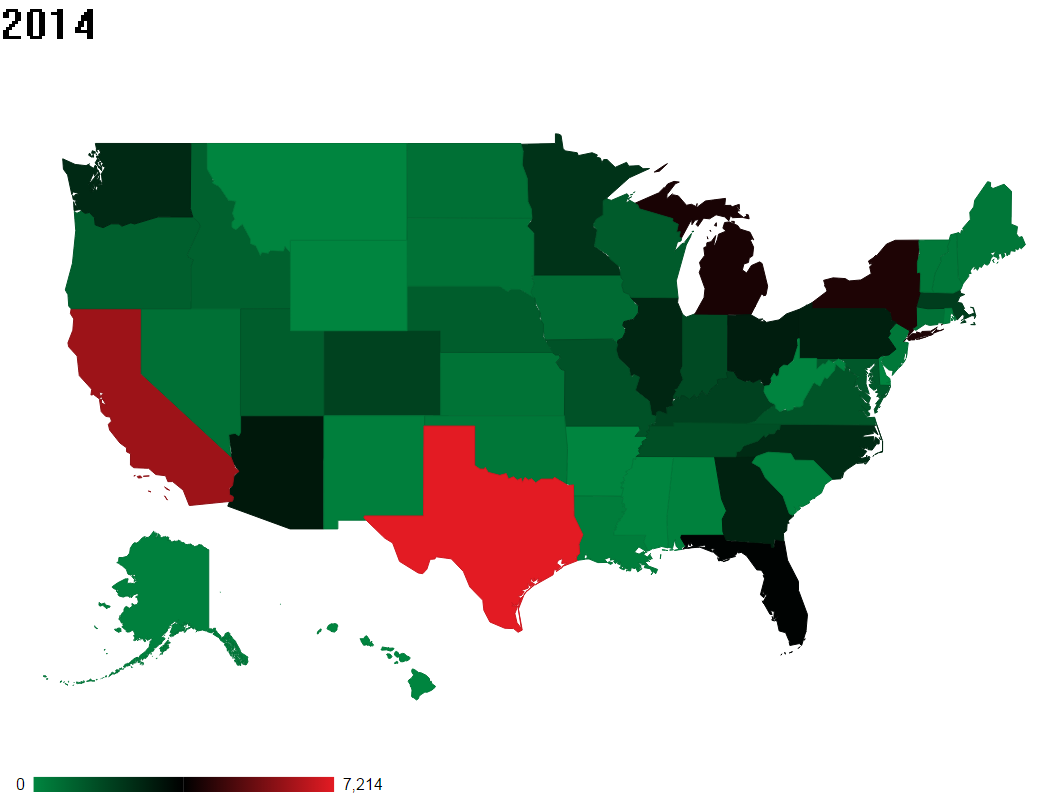
The refugee data is from U.S. Department of Health & Human Services.
Below, I’ve created a total US refugee arival line chart by year. As well as, a state distribution map for each year.