Monthly Archives: July 2015

Cook County Employee Healthcare Costs by Department – June 2012

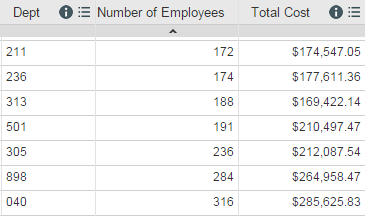
I came across an interesting data set while browsing datacatalog.cookcountyil.gov.  It can be found here.  Judging by the title, it appears to be healthcare costs for the month of June in the year of 2012.  There is no description, or any additional information I could find about it.  The data contains a department code, a number of employees, and a total cost.  It looks like this:

datascreenshot

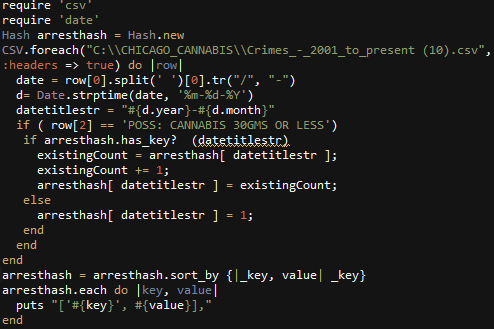
I was curious, so I took the average cost of employee count (Cost / Emp num), per department.  I correlated the department numbers to labels from an alternative dataset also found on cook county’s data catalog.

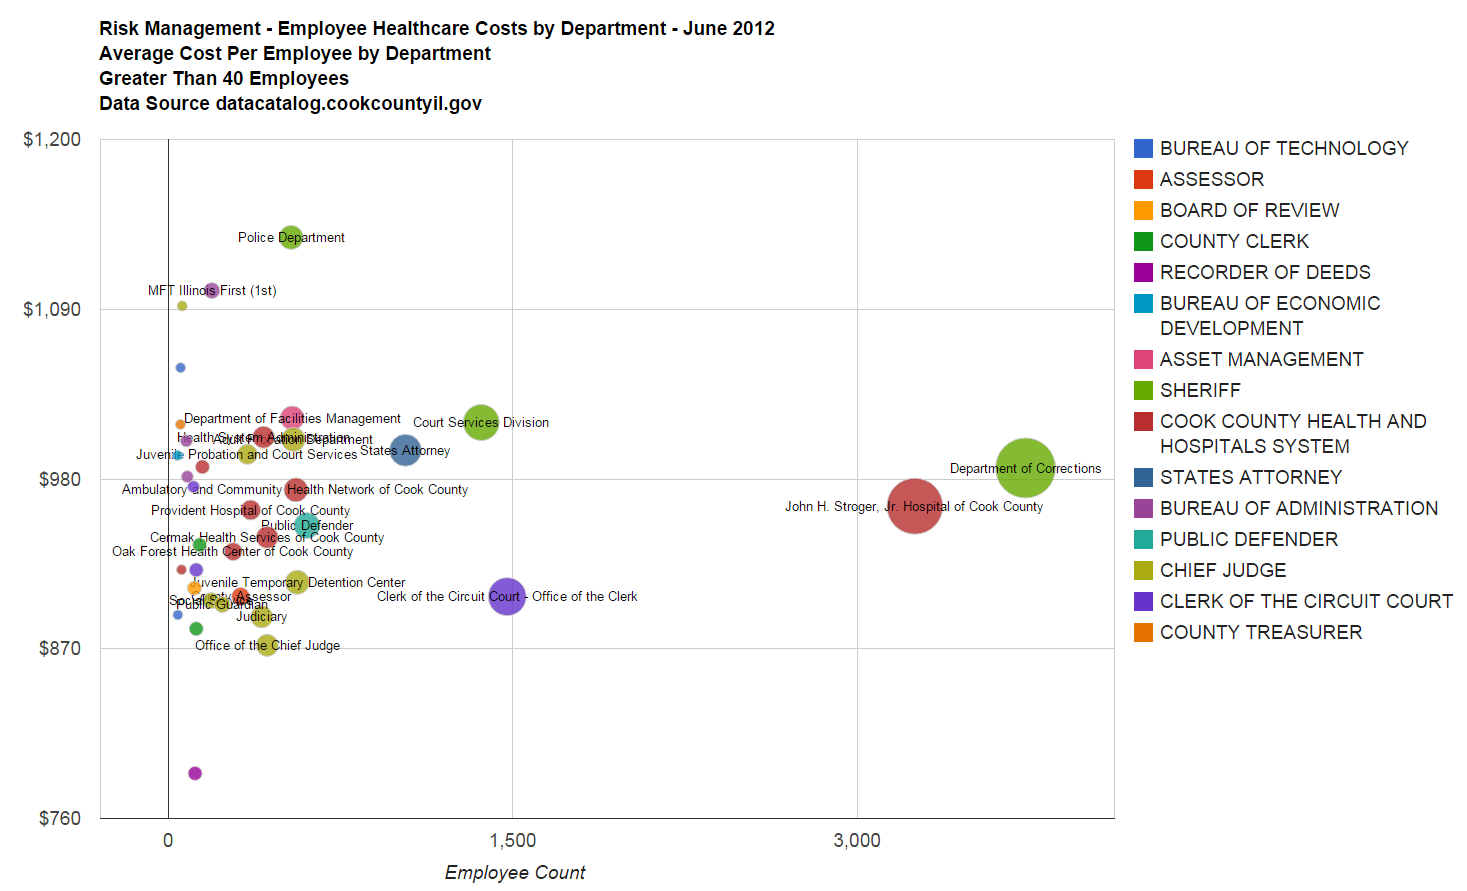
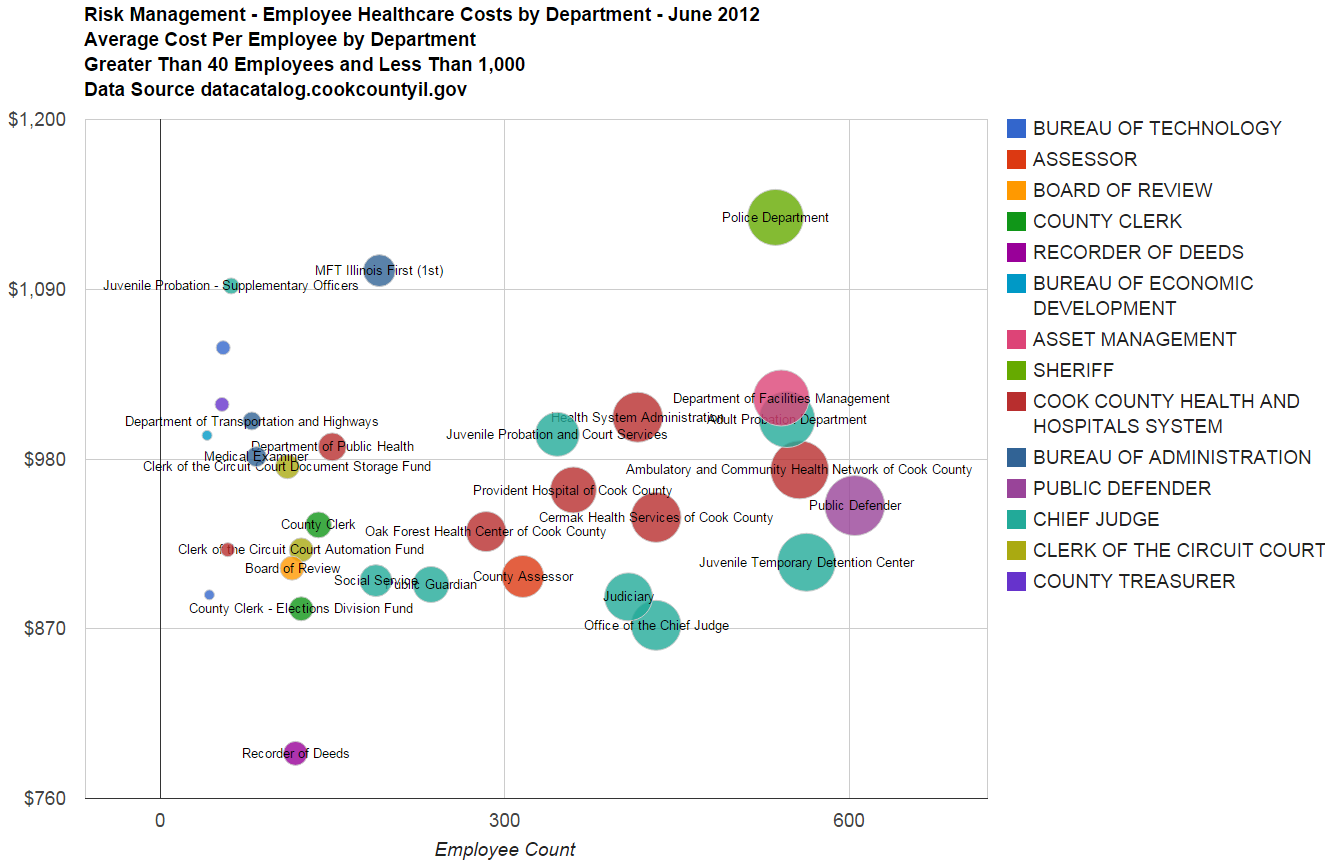
My experiment resulted in two bubble charts.

Greater than 40 Employees

AverageEmployeeCostPerDepartment_GreaterThan40Employees


Greater than 40 Employees and less than 1,000

AverageEmployeeCostPerDepartment_GreaterThan40EmployeesLessThan1000

And now here’s the second chart processed with Google’s Deep Dream

2

D3.js chord chart experiment

In response to an /r/datavizrequests submission, where a user provided this dataset, and requested a relationship mapping. I created a few visualizaitons using a web visualization library called D3.js. I used Mike Bostock’s Chord example to render these Chord Charts.

6 Concepts
corpchord

20 Concepts
coprchord2

Here is a link to the interactive version. Highlighting a concept will isolate its relationships.

isolatedrelationships

full_org_gilded


snoo

City of Chicago Impound Locations

Ever have your car towed and impounded by the city? If you have, chances are it ended up in one of two locations. 701 N. Sacramento, or 10300 S. Doty.

ChicagoTowImageArt

Below is a chart which displays the daily counts of impounded vehicles per each impound location. The timeline represents data from 2015/04/13 through 2015/07/12, or roughly 3 months. The data is from data.cityofchicago.org

Chicago 3 months of towed by city

Older post Graphing Chicago Towed Vehicles by Brand and Color

Chicago Cannabis Decriminalization

A look into Chicago Police Department’s incident reports for marijuana related arrests.

ChicagoCannabisArrests_STill

The chart below displays over 15 years of CPD’s Cannabis related arrests for possession of 30 grams or less. The data is from data.cityofchicago.org

ChicagoCannaBisArrests_2001-2015_monthly_lessthan30gms

Here is the ruby code written to accumulate the monthly totals. Additional data filtering was done on the Socrata website prior to exporting the csv data file. Google Charts was used to create the line chart. CartoDB was used to create the still of the torque map.
rubytoparsechicagocannabis